Contract renewal savings are easy to claim.
They are much harder to:
prove.
A supplier proposes a 12% increase.
Procurement negotiates it down to 5%.
Is the difference:
savings?
Cost avoidance?
Negotiated value?
Suppose the company simultaneously removes 300 unused licenses.
Should that reduction be counted as:
procurement savings,
demand reduction,
or both?
Then six months later, actual invoices show that the business purchased additional licenses and only half of the expected benefit materialized.
What should management report?
These questions explain why a mature contract renewal process needs more than a field called:
Savings.
It needs a consistent Contract Renewal Savings Methodology.
A credible methodology defines the baseline, separates different types of value, prevents double counting, distinguishes negotiated from realized results, and establishes how Finance validates reported benefits. These principles are consistent with broader procurement savings methodologies, which emphasize explicit baselines, separate treatment of cost reduction and cost avoidance, and validation of realized benefits.
For Contract Renewal Tracker, this could eventually become a dedicated Renewal Savings & Value Management module.
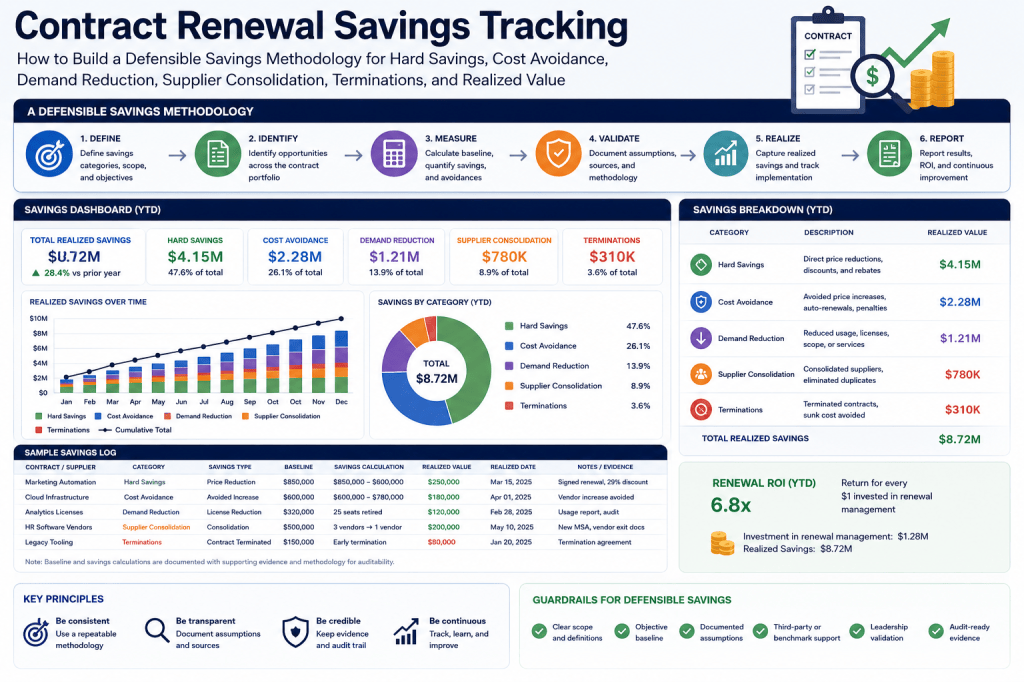
What Is Contract Renewal Savings Tracking?
Contract renewal savings tracking measures the financial impact created when an existing contractual commitment is:
- renewed;
- renegotiated;
- reduced;
- consolidated;
- replaced;
- extended;
- terminated.
The objective is not simply to calculate:
Old Contract Value − New Contract Value
That calculation is sometimes correct.
Often:
it is not.
Instead, renewal savings tracking should explain:
What changed, why did it change, what baseline are we comparing against, and how much value actually reached the business?
The Golden Rule: No Baseline, No Defensible Saving
Every savings claim begins with:
a baseline.
The baseline represents:
what the organization reasonably would have spent without the intervention being measured.
Without that reference point:
the savings number has no context.
Procurement guidance commonly emphasizes agreeing and documenting the baseline before claiming savings, because disagreements about the baseline are one of the main reasons Finance challenges procurement-reported value.
Common Contract Renewal Baselines
Possible baselines include:
Previous Contract Value
What the organization currently pays.
Previous Unit Price
Useful when volumes change.
Supplier Renewal Proposal
What the supplier initially proposed.
Approved Budget
What Finance expected to spend.
Market Benchmark
What comparable market pricing indicates.
Indexed Baseline
Previous price adjusted using an agreed inflation or market index.
Each answers:
a different question.
Why Baseline Selection Matters
Consider:
Current contract:
€500,000.
Supplier renewal proposal:
€575,000.
Final negotiated contract:
€525,000.
Using the current contract as baseline:
€500,000 − €525,000
=
−€25,000
Spend increased:
€25,000.
Using the supplier proposal:
€575,000 − €525,000
=
€50,000
The negotiation avoided:
€50,000.
Both numbers are correct.
But they mean:
different things.
Correct Reporting
Report:
Spend Change vs Current Contract
+€25,000
Cost Avoidance vs Supplier Proposal
€50,000
Do not report:
€50,000 savings
without explaining:
the baseline.
That is exactly how Procurement loses credibility with:
Finance.
The Seven Core Renewal Value Categories
Contract Renewal Tracker should eventually distinguish at least:
- Hard Savings
- Cost Avoidance
- Demand Reduction
- Supplier Consolidation
- Spend Elimination
- Working-Capital / Commercial Value
- Risk Avoidance
These categories should not automatically be:
added together.
They represent:
different forms of value.
1. Hard Savings
Hard savings occur when:
the comparable cost actually decreases.
Example:
Current annual contract:
€500,000.
New annual contract:
€450,000.
Comparable scope:
unchanged.
Hard savings:
€50,000 annually.
Formula:
Baseline Cost − New Cost
Hard Savings Example
Previous:
10,000 units × €50
=
€500,000.
New:
10,000 units × €45
=
€450,000.
Hard savings:
10,000 × €5
=
€50,000.
This is a clean:
price reduction.
Hard Savings Percentage
Formula:
(Baseline − New Cost) ÷ Baseline × 100
Example:
€50,000 ÷ €500,000
=
10%.
2. Cost Avoidance
Cost avoidance is different.
It occurs when Procurement prevents:
a future increase
rather than reducing:
the existing cost.
This distinction is widely used in procurement measurement: cost reduction lowers the existing baseline, whereas cost avoidance mitigates an expected future increase.
Cost Avoidance Example
Current:
€500,000.
Supplier proposal:
€575,000.
Final:
€525,000.
Cost avoidance:
€575,000 − €525,000
=
€50,000.
But:
actual spend still increased:
€25,000.
Therefore report:
Cost Avoidance: €50K
and:
Net Spend Increase: €25K
separately.
Why Cost Avoidance Matters
Cost avoidance is still:
commercial value.
If Procurement had done nothing:
the organization might have paid:
€575K.
Instead:
it pays €525K.
That intervention matters.
But Finance may treat it differently from:
P&L savings.
That is why:
classification matters.
3. Demand Reduction
One of the largest sources of renewal value often comes from:
buying less.
This is especially relevant for:
- SaaS;
- telecom;
- cloud;
- fleet;
- facilities;
- maintenance;
- professional services.
Demand management is also recognized in procurement savings frameworks as a distinct way of reducing expenditure through changes in volumes or requirements.
SaaS Example
Current:
1,000 licenses.
Unit price:
€500.
Spend:
€500,000.
Usage review finds:
only 650 active users.
Renewal quantity:
Assuming the same unit price:
700 × €500
=
€350,000.
Demand reduction:
300 × €500
=
€150,000.
This is not:
price negotiation.
It is:
quantity optimization.
Why Separate Price and Volume?
Suppose the new agreement is:
700 licenses × €450
=
€315,000.
Total reduction:
€185,000.
But two things happened.
Demand Reduction
300 × €500
=
€150,000.
Price Reduction
700 × €50
=
€35,000.
Total:
€185,000.
That decomposition tells management:
where the value came from.
Volume normalization is important because total spend can rise or fall simply because quantities change; separating price and volume effects makes the savings calculation more credible.
4. Supplier Consolidation
Contract renewals often create an opportunity to combine:
multiple agreements.
Example:
Supplier A:
€250K.
Supplier A — Business Unit B:
€180K.
Supplier A — France:
€220K.
Supplier A — Netherlands:
€150K.
Total:
€800K.
The organization negotiates:
one consolidated agreement:
€700K.
Consolidation value:
€100K annually.
But Identify the Source
The €100K may come from:
- volume discount;
- eliminated duplicate services;
- standardized products;
- reduced administrative fees.
Where practical:
capture those components.
This improves:
future analysis.
5. Spend Elimination
Sometimes the best renewal outcome is:
not renewing.
Example:
Unused analytics platform:
€75K/year.
Business confirms:
no replacement required.
Contract terminated:
before auto-renewal.
Recurring spend eliminated:
€75K.
This is a powerful renewal outcome.
Spend Elimination vs Avoided Commitment
There are two perspectives.
If the organization had been:
actively paying €75K
and removes the service:
this may qualify under the organization’s methodology as:
spend reduction.
If the service would otherwise have:
auto-renewed for another €75K,
the organization can also identify:
€75K of avoided future commitment.
Do not count:
both.
That would be:
double counting.
6. Working-Capital and Commercial Value
Not every valuable negotiation changes:
contract price.
Suppose payment terms change from:
Net 30
to:
Net 60.
Annual contract value:
unchanged.
Hard savings:
€0.
But:
cash remains inside the organization longer.
That is:
working-capital value.
Savings methodologies can legitimately distinguish working-capital improvements from direct cost reductions rather than forcing them into one savings number. (SIG)
Other Commercial Improvements
Examples include:
- better payment terms;
- reduced deposits;
- improved rebates;
- lower minimum commitments;
- stronger service credits;
- reduced termination fees.
Track them.
But do not automatically label them:
hard savings.
7. Risk Avoidance
Some renewal interventions prevent:
financial or operational risk.
Example:
€1M critical supplier agreement.
Notice period:
90 days.
The company intends:
to replace the supplier.
Contract Renewal Tracker identifies:
the deadline.
Termination is completed:
on time.
Potential unwanted renewal:
€1M.
You could report:
Avoided Renewal Commitment: €1M
provided:
the methodology and evidence support it.
But:
do not automatically report:
€1M Hard Savings.
The Importance of Savings Taxonomy
Every value record should therefore contain:
Savings Type
rather than:
only:
Savings Amount.
Possible values:
| Type | Meaning |
|---|---|
| Hard Savings | Reduction against comparable existing cost |
| Cost Avoidance | Prevented future increase |
| Demand Reduction | Lower quantities or requirements |
| Consolidation | Value from combining contracts/suppliers |
| Spend Elimination | Removed recurring requirement |
| Working Capital | Improved cash/payment position |
| Risk Avoidance | Prevented contractual/operational exposure |
| Productivity | Internal efficiency benefit |
| Other Value | Non-standard benefit |
This becomes:
the foundation of credible reporting.
Never Combine Everything Into “Savings”
Suppose a renewal generates:
Hard Savings:
€100K.
Cost Avoidance:
€150K.
Working-Capital Value:
€40K.
Avoided Commitment:
€300K.
Do not necessarily display:
Total Savings = €590K
That implies:
all categories are financially equivalent.
They are not.
Better:
Hard Savings
€100K.
Cost Avoidance
€150K.
Avoided Commitment
€300K.
Working-Capital Improvement
€40K.
This is:
much more credible.
The Most Dangerous Problem: Double Counting
Savings reporting becomes unreliable when:
the same value appears in:
multiple categories.
Consider:
Current:
1,000 licenses × €500
=
€500K.
New:
700 licenses × €450
=
€315K.
Total spend reduction:
€185K.
You calculate:
Demand Reduction:
€150K.
Price Savings:
€35K.
Correct.
If you then report:
Total Contract Reduction:
€185K
plus:
Demand Savings:
€150K
plus:
Price Savings:
€35K,
you report:
€370K.
Actual reduction:
€185K.
That is:
double counting.
A Core Product Rule
Contract Renewal Tracker should enforce:
Savings components may explain total value, but cannot automatically be added again to the total.
This could become:
an important financial-control feature.
Savings Decomposition
A better structure:
Total Comparable Spend Reduction
€185K.
Made up of:
Demand Reduction:
€150K.
Price Reduction:
€35K.
Now:
the components reconcile.
Savings Bridge
A useful analytical model is:
Previous Spend
↓
Volume Change
↓
Scope Change
↓
Market / Inflation Change
↓
Supplier Proposal
↓
Negotiation Effect
↓
Final Contract Value
This creates:
a financial bridge.
Example Savings Bridge
Previous Spend:
€1,000,000.
Demand Reduction:
−€100,000.
Supplier Inflation:
+€90,000.
New Scope:
+€50,000.
Negotiation:
−€70,000.
Final:
€970,000.
Net reduction:
€30K.
But Procurement also avoided:
€70K of proposed increase.
Both facts are visible.
Inflation Complicates Savings
Suppose:
current price:
€100.
Market inflation:
10%.
Reasonable indexed baseline:
€110.
Negotiated price:
€105.
Compared with:
current price,
cost increased:
5%.
Compared with:
inflation-adjusted baseline,
Procurement avoided:
€5.
This can be legitimate.
But only if:
the index and methodology were agreed.
Do Not Invent an Inflation Baseline After Negotiation
That creates:
obvious credibility problems.
Baseline methodology should ideally be:
established before the negotiation begins.
This is one reason Finance should participate in:
savings governance.
Budget Baseline
Another possibility:
approved budget.
Suppose:
budget:
€600K.
Final renewal:
€550K.
Budget variance:
−€50K.
But previous spend:
€500K.
So:
spend increased:
€50K.
Again:
both numbers matter.
Report:
€50K favorable to budget
and:
€50K increase vs previous contract.
Do not call both:
savings.
Market Benchmark Baseline
Suppose:
no previous contract exists.
Benchmark:
€120/unit.
Negotiated:
€105.
Quantity:
10,000.
Benchmark-based value:
€150K.
Useful.
But benchmark quality matters.
Record:
the source,
date,
and:
methodology.
Baseline Hierarchy
A company could define:
preferred baselines.
For example:
Priority 1
Comparable historical cost.
Priority 2
Finance-approved budget.
Priority 3
Supplier opening proposal.
Priority 4
Independent benchmark.
The appropriate hierarchy will depend on:
the savings category.
Baseline Record
Every savings entry should capture:
Baseline Type
Baseline Amount
Baseline Period
Baseline Volume
Baseline Currency
Baseline Source
Approved By
Approval Date
That makes:
the calculation auditable.
Recurring vs One-Time Savings
This is another critical distinction.
Example:
Supplier provides:
€30K implementation credit.
That is:
one-time.
Supplier also reduces:
annual subscription by €20K.
That is:
recurring.
Do not combine them without:
classification.
Report
Recurring Annual Savings
€20K.
One-Time Benefit
€30K.
Much clearer.
Annualized Savings
Suppose a new agreement begins:
July 1.
Annual recurring saving:
€120K.
Current-year impact:
approximately €60K.
Annualized run-rate:
€120K.
Finance needs:
both.
In-Year vs Run-Rate Savings
Track:
In-Year Savings
Impact during:
current financial year.
Annualized Savings
Expected full-year recurring impact.
This is important for:
budget reporting.
Multi-Year Savings
Suppose:
annual savings:
€50K.
Contract term:
3 years.
Nominal contractual value:
€150K.
But be careful about reporting:
€50K annual savings
and:
€150K multi-year value
in the same total.
That again creates:
double counting.
Recommended Reporting
Annualized Recurring Savings
€50K.
Contract-Term Value
€150K.
Different:
measures.
Multi-Year Price Escalation
Suppose:
Year 1:
€500K.
Year 2:
€515K.
Year 3:
€530,450.
Do not calculate savings by simply:
multiplying Year 1 × 3.
Use:
actual contractual economics.
Currency Effects
International portfolios add:
another problem.
Suppose:
USD contract
reported in:
EUR.
Exchange rates move.
Was the change caused by:
Procurement
or:
FX?
Track:
Local Currency Value
and:
Reporting Currency Value.
Where material:
separate FX impact.
Tax Treatment
VAT and other taxes can also distort:
comparisons.
Organizations should establish:
whether savings are measured:
gross
or:
net of recoverable taxes.
Use:
one consistent policy.
Scope Changes
A supplier contract changes from:
basic support
to:
premium support.
Price increases:
20%.
That does not necessarily mean:
the supplier increased price 20%.
The scope changed.
Savings methodology must normalize:
comparable scope.
Like-for-Like Comparison
Always ask:
Are we comparing the same thing?
If not:
adjust the baseline.
This is especially important for:
professional services,
cloud,
software bundles,
and:
outsourcing.
Specification Changes
Suppose:
premium hardware
is replaced with:
standard hardware.
Savings may be real.
But the source is:
specification optimization.
Classify accordingly.
This helps distinguish:
commercial negotiation
from:
business-demand decisions.
Procurement Contribution
Another governance question:
Who created the value?
If the business simply:
closed an office,
Procurement should not necessarily claim:
all associated contract reduction
as:
negotiated savings.
The platform can track:
Value Source
such as:
Procurement.
Business Owner.
Finance.
IT.
Joint.
Automated Renewal Control.
This makes reporting:
more credible.
Savings Attribution
Example:
Demand Reduction:
€100K.
Business Owner contribution:
70%.
Procurement:
30%.
You do not necessarily need:
percentage attribution
for MVP.
But a simple:
Value Source
field can help.
Negotiated vs Contracted vs Realized
This is one of the most important distinctions in the entire methodology.
A negotiated benefit is not necessarily:
a realized benefit.
Procurement frameworks increasingly distinguish expected or negotiated value from value that has actually materialized, because implementation, purchasing behavior and invoice leakage can reduce the final financial impact. (GEP)
Stage 1 — Identified
Potential opportunity:
€200K.
Stage 2 — Negotiated
Supplier agrees:
€150K.
Stage 3 — Contracted
Executed agreement contains:
€140K.
Stage 4 — Implemented
Business changes:
licenses,
orders,
process.
Expected:
€130K.
Stage 5 — Realized
Actual invoices confirm:
€115K.
This is the:
real value chain.
Why Value Leaks
Negotiated savings may not materialize because:
- users keep buying old products;
- excess licenses remain;
- invoices contain wrong pricing;
- implementation is delayed;
- volumes increase;
- off-contract spend continues;
- supplier credits are not received.
Therefore:
contract signature
is not:
the end of savings management.
Realized Savings
A particularly strong definition is:
value confirmed against actual financial transactions.
Recent procurement guidance describes realized savings as verified reductions supported by invoice or financial data rather than merely negotiated or forecast amounts. (Suplari)
That is the standard Contract Renewal Tracker should eventually aim for.
Savings Realization Rate
Formula:
Realized Value ÷ Contracted Value × 100
Example:
Contracted:
€150K.
Realized:
€120K.
Realization Rate:
80%.
That becomes:
an important KPI.
Savings Leakage
Formula:
Contracted Value − Realized Value
Example:
€150K − €120K
=
€30K leakage.
Now management can investigate:
why.
Finance Validation
Procurement should not:
grade its own homework
for material financial claims.
Finance validation provides:
independent credibility.
A mature process should establish definitions and validation rules jointly, and preserve evidence supporting the baseline and actual result. (Simfoni)
Finance Validation Workflow
Possible states:
Draft
↓
Submitted
↓
Finance Review
↓
Validated
or:
Rejected
or:
Adjusted
↓
Realized
This fits naturally into:
Contract Renewal Tracker.
Example
Procurement:
€120K savings.
Finance review:
€90K validated.
Reason:
€30K resulted from:
business volume reduction unrelated to negotiation.
Store:
both values.
Do not overwrite:
the original calculation.
Evidence Requirements
For significant savings, evidence could include:
- previous contract;
- supplier proposal;
- final contract;
- price schedule;
- invoice;
- purchase order;
- utilization report;
- quantity analysis;
- termination notice;
- Finance approval.
The precise evidence depends on:
the savings type.
Evidence by Savings Type
Hard Savings
Previous pricing + new pricing.
Cost Avoidance
Supplier proposal + final agreement.
Demand Reduction
Usage evidence + quantity change.
Termination
Previous commitment + termination evidence.
Realized Savings
Actual invoices or financial records.
This makes:
validation systematic.
Savings Confidence
Before Finance validation:
show confidence.
For example:
Estimated
Supported
Validated
Realized
This is better than:
pretending every figure has equal certainty.
Savings Status Model
A useful status model:
Opportunity
Potential value identified.
Forecast
Expected result.
Negotiated
Commercial agreement reached.
Contracted
Signed.
Validated
Finance accepted.
Realized
Actual impact confirmed.
This could become:
the backbone of a future Savings module.
Contract Renewal Savings Record
A comprehensive record could contain:
Contract
Supplier X SaaS.
Decision
Reduce + Renegotiate.
Previous Annual Spend
€500K.
Supplier Proposal
€575K.
Final Annual Spend
€390K.
Previous Quantity
1,000.
Final Quantity
Previous Unit Price
€500.
Final Unit Price
€487.50.
Now:
the system decomposes:
the outcome.
Demand Reduction
200 × €500
=
€100K.
Price Reduction
€12.50 × 800
=
€10K.
Comparable Hard Savings
€110K.
Supplier Proposal Avoidance
Supplier proposal:
€575K.
Final:
€390K.
Difference:
€185K.
But:
do not report:
€110K + €185K
=
€295K.
The cost-avoidance number overlaps with:
the final spend reduction.
They answer:
different questions.
This Is Where Software Can Help
Spreadsheets make it easy to:
accidentally double count.
Contract Renewal Tracker could automatically detect:
overlapping value categories.
For example:
Warning: Supplier Proposal Avoidance overlaps with reported Hard Savings. These values should not be aggregated into the same total.
That is a genuinely useful feature.
Savings Validation Rules
The platform could enforce rules such as:
IF savings_type = HARD_SAVINGSTHEN historical_baseline_required = TRUE
IF savings_type = COST_AVOIDANCETHEN future_cost_baseline_required = TRUE
IF savings_type = DEMAND_REDUCTIONTHEN quantity_before_and_after_required = TRUE
IF status = REALIZEDTHEN realization_evidence_required = TRUE
This turns:
methodology
into:
software controls.
Savings Methodology as Configuration
Different customers will use:
different Finance policies.
Therefore Contract Renewal Tracker should eventually allow:
configurable methodology.
For example:
Customer A recognizes:
cost avoidance.
Customer B reports it:
separately.
Customer C only includes:
Finance-validated hard savings
in executive totals.
The platform should support:
all three.
Organization-Level Savings Policy
Settings could define:
Allowed Savings Types
Approved Baselines
Annualization Rules
Finance Validation Threshold
Currency Policy
Tax Treatment
Realization Period
Evidence Requirements
This would make:
the Savings module
enterprise-ready.
Finance Validation Threshold
Example:
Savings <€10K:
Manager validation.
€10K–€100K:
Finance Business Partner.
€100K:
Controller.
This creates:
proportionate governance.
Savings Approval Matrix
Just like:
contract approval,
savings validation can have:
thresholds.
That is a useful future feature.
Renewal Savings Dashboard
A strong dashboard might show:
Hard Savings YTD
€420K.
Cost Avoidance
€760K.
Demand Reduction
€310K.
Spend Eliminated
€190K.
Realized Savings
€350K.
Savings Leakage
€70K.
Finance Validation Pending
€140K.
This is:
far more credible than:
Total Savings = €1.8M
Savings by Contract Decision
Renew
€120K.
Renegotiate
€450K.
Reduce
€310K.
Replace
€180K.
Terminate
€250K.
This tells:
where value comes from.
Savings by Category
Software:
€550K.
Telecom:
€220K.
Facilities:
€160K.
Professional Services:
€380K.
This supports:
category strategy.
Savings by Supplier
This can identify:
which suppliers consistently create:
negotiation opportunities.
Savings by Business Unit
Useful for:
internal benchmarking.
But remember:
business-unit spend differs.
Use:
percentages
alongside:
absolute values.
Savings Rate
Formula:
Validated Hard Savings ÷ Addressable Renewal Spend
Example:
Validated hard savings:
€500K.
Addressable renewals:
€10M.
Savings rate:
5%.
This can be useful.
Addressable Spend Matters
Not every contract can realistically produce:
savings.
Examples:
regulated tariffs,
fixed government fees,
certain sole-source contracts.
Using total renewal spend as:
the denominator
can distort:
performance.
Savings Forecast
Before negotiations:
the system can show:
Potential:
€1.8M.
Forecast:
€1.2M.
Negotiated:
€900K.
Contracted:
€780K.
Realized:
€620K.
This creates:
a savings funnel.
Conversion Rates
Potential → Negotiated.
Negotiated → Contracted.
Contracted → Realized.
These tell:
where value leaks.
Example
Potential:
€2M.
Negotiated:
€1.4M.
Contracted:
€1.2M.
Realized:
€900K.
Contract-to-realization rate:
75%.
That deserves:
investigation.
Savings Leakage Analysis
Potential causes:
Pricing Leakage
Supplier invoices wrong rate.
Volume Leakage
Business purchases more than planned.
Adoption Leakage
New agreement not fully adopted.
Compliance Leakage
Off-contract buying continues.
Timing Leakage
Implementation delayed.
These could become:
future analytics.
Contract Renewal ROI
Once savings are reliable:
ROI becomes much more meaningful.
Formula:
Validated Renewal Value ÷ Renewal Management Cost
Example:
Validated hard savings:
€500K.
Renewal-management operating cost:
€100K.
Ratio:
5×
But again:
keep hard savings,
cost avoidance,
and:
risk avoidance
separate.
Contract Renewal Tracker ROI
For the SaaS product:
customer might calculate:
Platform cost:
€3,000/year.
Validated hard savings:
€20K.
Avoided unwanted renewal:
€15K.
Administrative productivity:
€5K.
Report separately:
Direct Hard-Savings ROI
6.7×.
Additional Avoided Commitment
€15K.
Productivity Benefit
€5K.
This is:
more credible than:
claiming 13× ROI from one blended number.
Renewal Savings and AI
AI can help:
classify and explain savings.
But it should not:
invent financial value.
For example:
AI can suggest:
This appears to be demand reduction because the license quantity decreased from 1,000 to 700 while unit pricing remained unchanged.
Good.
But:
Finance rules determine:
how it is reported.
AI Savings Assistant
A future assistant could ask:
What savings did we achieve on Microsoft renewals this year?
Then answer:
Twelve renewals produced €180K of Finance-validated hard savings, €240K of separately reported cost avoidance, and €95K of demand reduction.
Excellent.
Explain the Calculation
User:
How did you calculate the €180K?
Assistant:
shows:
the contracts,
baseline,
final value,
and:
calculation.
This is essential:
explainability.
AI Double-Counting Detection
AI could also flag:
The €40K license reduction appears to be included in both Demand Reduction and Total Contract Savings. Review before reporting.
This would be:
highly useful.
AI Baseline Anomaly Detection
Example:
The baseline used for this renewal is 18% higher than last year’s actual spend. Verify whether the baseline includes a scope increase.
Again:
AI helps:
quality control.
Savings Audit Trail
For every savings claim:
store:
who created it,
who changed it,
who validated it,
what evidence supported it,
and:
when it became realized.
That turns savings tracking into:
auditable financial intelligence.
Beta Version
For the first Contract Renewal Tracker beta:
keep this very simple.
Capture:
Previous Annual Value
Final Annual Value
Renewal Decision
Then calculate:
Annual Value Change
That is enough:
initially.
Beta Formula
Final Annual Value − Previous Annual Value
Example:
Previous:
€100K.
Final:
€92K.
Change:
−€8K.
Label:
Annual Contract Value Change
rather than automatically:
Savings.
That is safer.
Why This Is Better for Beta
You do not yet need to decide:
whether:
the €8K
is:
hard savings,
scope reduction,
or:
demand reduction.
Capture:
the objective financial movement first.
Classification can come:
later.
Post-Beta Phase 1
Add:
Supplier Proposal.
Now calculate:
cost avoidance.
Phase 2
Add:
Previous Quantity,
New Quantity,
Previous Unit Price,
New Unit Price.
Now separate:
price
and:
demand.
Phase 3
Add:
Savings Type.
Phase 4
Add:
Finance Validation.
Phase 5
Add:
Realization Tracking.
Phase 6
Add:
Invoice / financial integration.
Phase 7
Add:
AI Savings Intelligence.
This is a logical roadmap.
Contract Renewal Tracker Beta Launch — September 21, 2026
Contract Renewal Tracker is launching its first SaaS beta on September 21, 2026. The beta establishes the structured renewal records needed to understand contract values, deadlines, owners, decisions, and financial changes across each renewal cycle. As the platform develops, this foundation can support defensible hard-savings, cost-avoidance, demand-reduction, supplier-consolidation, termination-value, Finance-validation, and realized-savings reporting without mixing fundamentally different types of value. [Notify Me When the Beta Launches →] (One launch notification only — no newsletter or ongoing marketing emails.)
Lead Magnet Opportunity
This article should become:
Contract Renewal Savings Calculation Template
The spreadsheet could contain:
- supplier;
- contract;
- previous value;
- previous quantity;
- previous unit price;
- supplier proposal;
- new quantity;
- new unit price;
- final value;
- baseline type;
- savings type;
- hard savings;
- cost avoidance;
- demand reduction;
- one-time value;
- recurring value;
- Finance validation;
- realized value;
- evidence.
That would be:
an excellent Procurement lead magnet.
Second Lead Magnet
Create:
Contract Renewal Savings Methodology Policy Template
Sections:
- Purpose.
- Definitions.
- Approved Baselines.
- Hard Savings.
- Cost Avoidance.
- Demand Reduction.
- Consolidation.
- Terminations.
- One-Time vs Recurring.
- Annualization.
- Finance Validation.
- Realization.
- Double Counting.
- Evidence.
- Reporting.
This could rank for:
procurement savings methodology
as well as:
contract renewal savings.
Interactive Savings Calculator
A website calculator could ask:
Current Annual Cost
€500,000.
Supplier Proposal
€575,000.
Current Quantity
1,000.
Renewal Quantity
Final Contract Value
€390,000.
Then show:
Annual Spend Change
−€110K.
Demand Reduction Component
€100K.
Price Component
€10K.
Difference vs Supplier Proposal
€185K.
And explain:
Do not add these figures together because they represent overlapping comparisons.
That would be an unusually useful:
SEO tool.
Product Positioning
A strong future message:
Turn Renewal Savings Into Finance-Ready Evidence.
Another:
Know Exactly Where Every Renewal Saving Came From.
Another:
Track Savings Without Double Counting.
Another:
From Supplier Proposal to Realized Value.
And perhaps the strongest:
Don’t Just Claim Renewal Savings. Prove Them.
Why This Matters Strategically
Contract Renewal Tracker is gradually developing:
three distinct value propositions.
Control
Never lose:
a renewal deadline.
Intelligence
Know:
which contracts require attention.
Financial Value
Know:
what renewal actions actually saved or cost.
Together:
these are much stronger than:
a reminder application.
The Full Value Architecture
The emerging architecture becomes:
Contract Data
↓
Renewal Dates
↓
Notice Intelligence
↓
Risk Score
↓
Opportunity Score
↓
Priority Score
↓
Next-Best-Action
↓
Workflow
↓
Negotiation
↓
Decision
↓
Outcome
↓
Savings Classification
↓
Finance Validation
↓
Realized Value
↓
Renewal Memory
This is increasingly:
a full renewal intelligence platform.
Final Thoughts
The mathematics of renewal savings is:
not particularly difficult.
The difficult part is:
financial discipline.
A defensible methodology must answer:
What is the baseline?
What changed?
Was the change price, quantity, scope, or timing?
Is the benefit hard savings or cost avoidance?
Is it recurring or one-time?
Has Finance validated it?
Has it actually been realized?
Has the same value already been counted somewhere else?
If Contract Renewal Tracker can answer those questions consistently, it can provide something significantly more valuable than:
a savings field.
It can provide:
a traceable financial record of the value created through every renewal.
That creates credibility with:
Procurement,
Finance,
CFOs,
Private Equity operating teams,
and:
executive management.
And it closes one of the most important gaps in contract renewal management:
moving from “we negotiated a better deal” to “here is the validated financial evidence of what changed and what the business actually realized.”
Next Article in the Contract Renewal Tracker Series
The next article can connect the risk, opportunity, priority, next-best-action, and savings layers into the actual supplier negotiation process. It can define a structured Renewal Negotiation Brief containing the opening supplier proposal, historical pricing, target price, walk-away position, unused licenses, supplier-performance issues, consolidation leverage, contractual deadlines, previous concessions, and recommended negotiation strategy—potentially becoming another major intelligence module inside Contract Renewal Tracker.

