A contract renewal process should not end when the new agreement is signed.
That is only the execution point.
The organization should also ask:
What changed because we managed this renewal?
Did the supplier reduce its proposed increase?
Did the business remove unused licenses?
Did Procurement consolidate multiple agreements?
Did the organization avoid an unwanted auto-renewal?
Did a replacement supplier lower cost?
Did the renewal create a larger multi-year commitment?
Did the final outcome come in above or below budget?
Without structured outcome tracking, renewal management can become operationally busy but financially opaque.
This is why a mature Contract Renewal Tracker should not only monitor deadlines and decisions. It should capture the economic result of each renewal and distinguish between very different types of value:
Hard Savings
Cost Avoidance
Demand Reduction
Price Increase
Spend Eliminated
Supplier Consolidation
Risk Avoidance
Working-Capital Improvements
Renewal ROI
That creates a closed-loop model:
Renewal Identified
↓
Action Taken
↓
Commercial Outcome
↓
Financial Result
↓
Realized Value
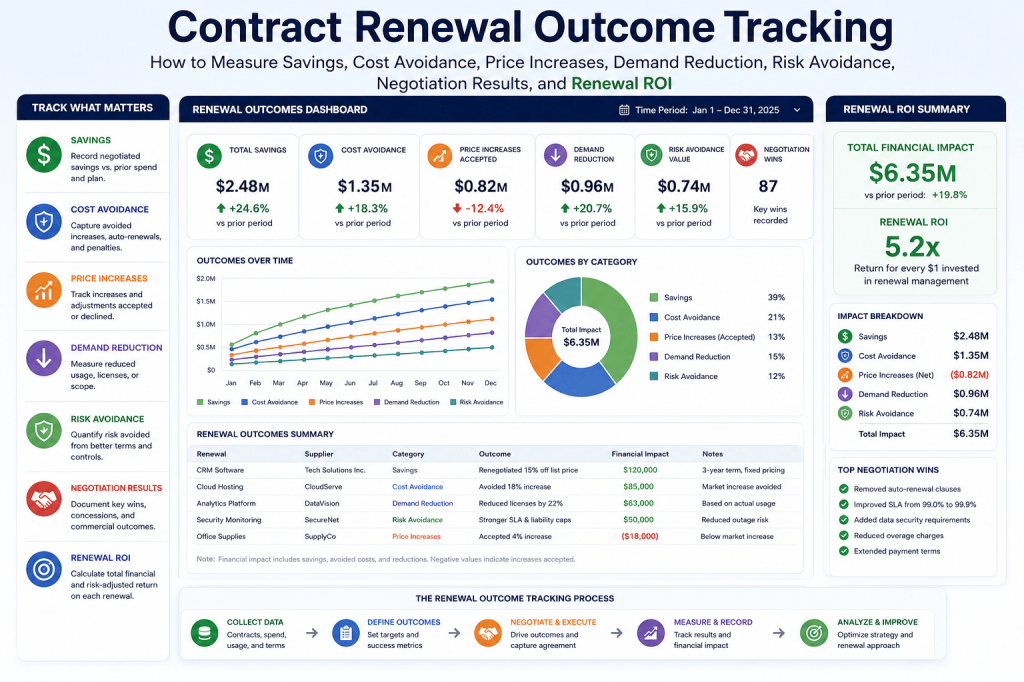
What Is Contract Renewal Outcome Tracking?
Contract renewal outcome tracking is the process of comparing the commercial position before a renewal with the final outcome after the renewal decision has been executed.
At minimum, it should capture:
- current contract value;
- supplier renewal proposal;
- final negotiated value;
- renewal decision;
- contract term;
- quantities or licenses;
- savings classification;
- realized value.
The goal is to answer:
What financial or operational value did this renewal process create?
Why Outcome Tracking Matters
Imagine Procurement completes:
100 renewals.
Management asks:
How much value did we create?
The answer should not be:
We negotiated a lot of contracts.
It should be:
€420K of hard savings, €690K of validated cost avoidance, €180K of demand reduction, and €300K of unwanted recurring spend terminated.
That creates:
measurable business value.
The Baseline Is Everything
Every savings calculation needs:
a baseline.
Without a clear baseline, the number is meaningless.
Possible baselines include:
- current contract value;
- previous 12-month spend;
- supplier proposal;
- approved budget;
- benchmark price.
These are not interchangeable.
The system should preserve:
which baseline was used.
The Four Core Financial Values
A strong contract renewal record should distinguish at least:
Current Value
What the organization currently pays.
Supplier Proposal
What the supplier initially asks for at renewal.
Approved / Expected Value
What the organization expects or authorizes.
Final Renewal Value
What the new agreement actually costs.
These four numbers unlock most renewal analytics.
Example
Current annual value:
€500K.
Supplier proposal:
€575K.
Approved target:
€525K.
Final value:
€515K.
Now multiple outcomes can be calculated.
Hard Savings
Hard savings normally means a reduction relative to the current comparable baseline.
Formula:
Current Value − Final Value
Example:
Current:
€500K.
Final:
€470K.
Hard savings:
€30K.
This is straightforward.
Cost Avoidance
Cost avoidance usually measures how much of an expected increase was prevented.
Formula:
Supplier Proposal − Final Value
Example:
Supplier Proposal:
€575K.
Final:
€525K.
Cost Avoidance:
€50K.
But note:
the organization is still paying:
€25K more than before.
That is why cost avoidance should not be mixed with hard savings.
Why the Distinction Matters
Suppose:
Current:
€500K.
Supplier Proposal:
€600K.
Final:
€550K.
Procurement could say:
We saved €50K.
Finance could respond:
Spend increased by €50K.
Both statements refer to different baselines.
A mature platform should show both:
Increase vs Current: +€50K
Cost Avoidance vs Supplier Proposal: €50K
This prevents misleading reporting.
Demand Reduction
Demand reduction occurs when the organization buys:
less.
Examples:
- fewer SaaS licenses;
- fewer mobile lines;
- fewer vehicles;
- reduced maintenance scope;
- lower cleaning frequency;
- smaller cloud commitment.
Formula:
Previous Quantity − Renewal Quantity × Unit Cost
where appropriate.
Example
Current licenses:
1,000.
Renewal quantity:
Unit price:
€400/year.
Demand reduction value:
300 × €400
=
€120K annually.
That is often a cleaner savings category than claiming a negotiated discount.
Price Savings vs Quantity Savings
These should ideally be separated.
Example:
Previous:
1,000 licenses × €500
=
€500K.
Renewal:
700 × €450
=
€315K.
Total reduction:
€185K.
Break it into:
Demand Reduction
300 × €500
=
€150K.
Price Improvement
700 × €50
=
€35K.
Total:
€185K.
This gives management a much better explanation.
Spend Eliminated Through Termination
If the business no longer needs:
a service,
termination may eliminate the recurring spend entirely.
Example:
Current annual cost:
€80K.
Decision:
Terminate.
Replacement cost:
€0.
Annual spend eliminated:
€80K.
This should be tracked separately from:
negotiated savings.
Termination With Replacement
Suppose:
Current supplier:
€300K.
Replacement supplier:
€240K.
Migration cost:
€50K.
Annual recurring reduction:
€60K.
Year-one net benefit:
€10K.
Year-two recurring benefit:
€60K.
This is more accurate than simply saying:
€60K saved.
Transition Cost Matters
Replacement economics should include:
- migration;
- implementation;
- training;
- dual-running;
- termination fees.
Otherwise:
the savings case can be overstated.
Multi-Year Outcome Tracking
A 3-year renewal should not be evaluated only by:
year-one price.
Track:
total contract value.
Example:
Current:
€400K/year.
New:
€370K/year.
Three-year term.
Annual hard saving:
€30K.
Nominal three-year reduction:
€90K.
But only if:
scope and baseline remain comparable.
Price Escalation Clauses
Multi-year agreements may include:
future increases.
Example:
Year 1:
€370K.
Year 2:
+3%.
Year 3:
+3%.
Total cost becomes:
higher than:
€1.11M.
Therefore:
renewal outcome tracking should include:
escalation mechanics where material.
Renewal Price Increase
Not every renewal creates savings.
Sometimes the final outcome is:
an increase.
Track it transparently.
Formula:
Final Value − Current Value
Example:
Current:
€500K.
Final:
€540K.
Increase:
€40K.
Percentage:
8%.
This is important for:
Finance.
Avoid Calling Every Negotiation a Saving
A supplier proposes:
+15%.
Procurement achieves:
+8%.
That is commercially valuable.
But spend still rises.
Report:
Cost Avoidance
7 percentage points negotiated away.
Final Spend Increase
8%.
That is credible.
Savings Classification
A useful taxonomy could include:
Hard Savings
Cost Avoidance
Demand Reduction
Supplier Consolidation
Spend Elimination
Working-Capital Improvement
Risk Avoidance
No Financial Change
Spend Increase
This makes portfolio reporting consistent.
Supplier Consolidation Savings
Suppose three contracts with the same supplier cost:
€600K combined.
A consolidated renewal costs:
€520K.
Savings:
€80K.
Track:
Savings Type = Supplier Consolidation
This helps Procurement understand:
where value is generated.
Duplicate Tool Elimination
Example:
Analytics Tool A:
€70K.
Analytics Tool B:
€50K.
Strategic standard:
Tool A.
Tool B terminated.
Annual recurring spend eliminated:
€50K.
That is a clear renewal outcome.
SaaS License Optimization
This deserves its own reporting category for technology-heavy organizations.
Track:
- purchased seats before;
- active seats;
- renewed quantity;
- unit price;
- resulting spend.
This allows:
license optimization analytics.
Cloud Commitment Optimization
Example:
Previous cloud commitment:
€2M.
Projected actual requirement:
€1.5M.
Renewal commitment:
€1.6M.
Avoided excess commitment:
€400K relative to previous commitment.
Again:
define the methodology clearly.
Supplier Performance Outcome
Not every improvement is financial.
A renewal may achieve:
- stronger SLA;
- better support;
- improved service credits;
- shorter response times.
These outcomes should also be captured.
Example
Old SLA:
99.5%.
New SLA:
99.9%.
Price unchanged.
Financial savings:
€0.
Operational improvement:
meaningful.
Do not force every renewal benefit into:
euros.
Contract-Term Improvements
Possible non-price outcomes:
- improved termination rights;
- lower liability exposure;
- better renewal caps;
- shorter notice period;
- improved data portability;
- more flexible volume terms.
These can create:
future value.
Renewal Flexibility Score
A future platform could track:
whether the renewal improved:
contractual flexibility.
For example:
Old term:
36 months.
New term:
12 months.
Old auto-renewal:
12 months.
New:
month-to-month.
This may be strategically valuable even if price remains unchanged.
Working-Capital Outcome
Example:
Payment terms move from:
Net 30
to:
Net 60.
That does not reduce:
contract value.
But it improves:
cash timing.
Finance may want to track:
this separately.
Risk Avoidance
Risk avoidance is more difficult to quantify.
Suppose Contract Renewal Tracker alerts:
the organization before a €250K unwanted auto-renewal.
Decision:
Terminate.
Can you claim:
€250K savings?
Possibly as:
Avoided Unwanted Renewal
but the methodology should be clear.
Do not combine it automatically with:
hard procurement savings.
Suggested Risk-Avoidance Category
Use:
Avoided Commitment
rather than:
Savings.
Example:
Auto-renewing annual value:
€250K.
Termination completed before deadline.
Avoided future commitment:
€250K.
This is understandable and defensible.
Risk Avoidance Should Be Evidence-Based
Require:
- auto-renewal confirmed;
- decision to terminate documented;
- notice delivered;
- renewal would otherwise have occurred.
This prevents:
inflated value claims.
Renewal Outcome Record
A strong outcome record could contain:
Previous Annual Value
€500K.
Supplier Proposal
€575K.
Final Annual Value
€520K.
Previous Quantity
1,000.
New Quantity
Term
24 months.
Hard Savings
€0.
Cost Avoidance
€55K.
Demand Reduction
€50K.
Net Increase vs Previous
€20K.
Now the story is:
transparent.
Avoid Double Counting
This is critical.
Suppose quantity reduction already lowered the final value.
Do not calculate:
the total difference
and:
then add quantity savings again
unless the methodology explicitly decomposes:
the same value.
Otherwise:
you double-count.
Example of Double Counting
Previous:
€500K.
Final:
€400K.
Difference:
€100K.
If €70K came from quantity reduction and €30K from price:
report:
Demand Reduction:
€70K.
Price Savings:
€30K.
Total:
€100K.
Do not report:
€100K + €70K + €30K
=
€200K.
Obvious mathematically.
Surprisingly common in reporting.
Savings Waterfall
A useful visual model:
Current Spend
↓
Demand Change
↓
Supplier Price Increase
↓
Negotiated Reduction
↓
Scope Changes
↓
Final Renewal Spend
This explains:
how the result was created.
Example
Current:
€1M.
Demand Reduction:
−€100K.
Supplier Inflation:
+€120K.
Negotiation:
−€70K.
New Scope:
+€30K.
Final:
€980K.
Net:
€20K reduction.
This is much more informative than:
“Saved €170K.”
Finance Validation
For material savings:
Finance should validate:
the methodology.
Possible statuses:
Unvalidated
Under Review
Validated
Rejected
Only validated amounts should appear in:
executive reporting.
Procurement Estimate vs Finance-Validated Value
Keep both.
Example:
Procurement estimated:
€120K.
Finance validated:
€90K.
Do not overwrite:
the original estimate.
Preserve:
history.
Realized vs Contracted Savings
Another important distinction.
A renewal contract may promise:
€100K annual savings.
But actual invoicing might only produce:
€80K.
Therefore track:
Contracted Savings
and:
Realized Savings.
Realization Funnel
Identified
↓
Validated
↓
Contracted
↓
Realized
This is a strong model.
Example
Identified:
€200K.
Validated:
€150K.
Contracted:
€130K.
Realized:
€115K.
Now management can see:
value leakage.
Why Realization Can Differ
Possible reasons:
- implementation delayed;
- quantities not reduced;
- invoice errors;
- new scope added;
- usage grew.
Outcome tracking should help:
explain this.
Realization Rate
Formula:
Realized Savings ÷ Contracted Savings
Example:
€115K ÷ €130K
=
88.5%.
This becomes:
a useful KPI.
Supplier Proposal Capture
Outcome tracking works much better if:
the initial proposal is captured.
Without it:
cost avoidance cannot be measured reliably.
This should therefore become:
a standard field once the product reaches procurement maturity.
Negotiation History
Track:
Initial Proposal.
Counteroffer 1.
Counteroffer 2.
Final.
This creates:
commercial memory.
Example
Supplier Initial:
€600K.
Procurement Target:
€500K.
Supplier Revision:
€560K.
Final:
€525K.
That history is valuable:
during the next renewal.
Negotiation Improvement
A simple metric:
Initial Supplier Proposal − Final Value
Example:
€600K − €525K
=
€75K.
Call it:
Negotiated Reduction from Initial Proposal
This is more precise than:
Savings.
Renewal Decision Outcome
Each decision type should produce:
different outcome metrics.
Renew
Track:
final value,
term,
price change,
concessions.
Renegotiate
Track:
initial proposal,
final value,
commercial improvements.
Reduce
Track:
quantity,
scope,
spend reduction.
Replace
Track:
old cost,
new cost,
transition cost,
net benefit.
Extend
Track:
extension duration,
cost,
reason.
Terminate
Track:
spend eliminated,
replacement cost,
avoided commitment.
This creates:
consistent analytics.
Extension Outcomes
Temporary extensions should be visible.
Example:
3-month extension:
€90K.
Alternative full-year renewal:
€360K.
If the extension creates time for replacement:
it may protect:
€270K of potential future commitment.
But again:
label carefully.
Renewal Outcome Status
Possible:
Pending
Provisional
Final
Finance Validated
Realized
This allows:
progressive certainty.
Outcome Confidence
For forecasts:
use:
High / Medium / Low.
For completed contracts:
outcome should become:
Final.
This keeps:
forecasting and actuals separate.
Renewal ROI
A useful high-level metric:
What value did renewal management create relative to its cost?
Simple formula:
Validated Renewal Value ÷ Renewal Management Cost
Example
Hard savings:
€200K.
Validated cost avoidance:
€300K.
Avoided unwanted renewals:
€100K.
Total separately classified value:
€600K.
Renewal-management platform and operating cost:
€60K.
Value-to-cost ratio:
10×.
But present:
the categories separately.
Do not hide:
methodology.
Software ROI
For Contract Renewal Tracker specifically:
suppose annual subscription:
€4,000.
Customer prevents:
one unwanted €20K renewal.
Direct avoided commitment:
5× annual platform cost.
This is an easy customer story.
But ROI Is Broader Than Savings
The platform may also create:
- administrative time savings;
- earlier decisions;
- better forecasts;
- reduced risk.
These may be valuable but harder to:
monetize reliably.
Be conservative.
Administrative Time Savings
Example:
renewal administration falls from:
10 hours/week
to:
Reduction:
4 hours.
Annual:
208 hours.
At:
€50/hour:
€10,400 capacity value.
This can be reported as:
productivity benefit,
not:
hard savings.
Do Not Mix Productivity With Procurement Savings
Keep:
Hard Savings
separate from:
Productivity Value
This maintains credibility.
Outcome KPI 1 — Hard Savings
Finance-validated recurring or one-time reductions.
KPI 2 — Cost Avoidance
Avoided supplier increases.
KPI 3 — Demand Reduction
Reduced licenses, capacity, or service scope.
KPI 4 — Spend Eliminated
Terminated unnecessary services.
KPI 5 — Price Increase
Actual increase relative to prior baseline.
This prevents:
only reporting positive outcomes.
KPI 6 — Negotiated Reduction
Initial supplier proposal minus:
final deal.
KPI 7 — Realization Rate
Contracted vs actual value.
KPI 8 — Renewal ROI
Value relative to:
platform/process cost.
KPI 9 — Savings per Renewal
Useful for:
portfolio analysis.
KPI 10 — Value by Decision Type
For example:
Reduce:
€420K.
Renegotiate:
€700K.
Terminate:
€310K.
Replace:
€180K.
This reveals:
where value is created.
KPI 11 — Value by Category
Software:
€800K.
Telecom:
€250K.
Facilities:
€180K.
Professional Services:
€400K.
This helps Procurement focus:
future effort.
KPI 12 — Value by Supplier
Identify:
which supplier relationships generate:
the most optimization opportunity.
KPI 13 — Value by Business Unit
This allows:
internal benchmarking.
KPI 14 — Value by Owner
Useful carefully.
Do not create perverse incentives.
But it can help:
understand performance.
KPI 15 — Renewal Forecast Accuracy
Expected value before negotiation
versus:
final value.
This supports:
Finance.
Renewal Outcome Dashboard
A strong dashboard could show:
Renewals Completed YTD
Previous Annual Value
€28M.
Final Annual Value
€27.2M.
Hard Savings
€420K.
Cost Avoidance
€890K.
Demand Reduction
€310K.
Avoided Commitments
€450K.
Final Price Increases
€620K.
This tells:
the full story.
Why Include Price Increases?
Because a credible dashboard should not only show:
wins.
If supplier inflation increased spend by:
€620K,
management should know.
This helps with:
budgeting and sourcing strategy.
Net Renewal Movement
One useful metric:
Final Portfolio Spend − Previous Comparable Spend
Example:
Previous:
€28M.
Final:
€27.2M.
Net reduction:
€800K.
This gives:
the actual recurring movement.
But Scope Changes Matter
If business demand fell:
20%,
the reduction may not be:
Procurement performance.
That is why:
decomposition matters.
Outcome Waterfall by Portfolio
Start:
Previous Contracted Spend:
€30M.
Demand Reduction:
−€1M.
Supplier Inflation:
+€1.5M.
Negotiation:
−€900K.
Terminations:
−€600K.
New Scope:
+€300K.
Final:
€29.3M.
That is an executive-quality view.
Procurement Outcome Dashboard
Procurement may focus on:
- negotiated reduction;
- hard savings;
- cost avoidance;
- supplier increases;
- consolidation.
Finance Outcome Dashboard
Finance focuses on:
- final commitment;
- budget variance;
- realized savings;
- forecast accuracy.
IT Outcome Dashboard
IT focuses on:
- licenses removed;
- utilization improvement;
- SaaS savings;
- cloud commitment optimization.
Operations Outcome Dashboard
Operations focuses on:
- service volume changes;
- supplier performance;
- continuity;
- cost outcome.
Executive Outcome Dashboard
Leadership wants:
- total renewal exposure;
- net spend movement;
- validated value;
- key risks;
- strategic outcomes.
Again:
same underlying data,
different view.
Outcome Tracking and Next-Best-Action
This article closes the loop from:
the previous article.
Recommendation:
Review License Quantity
Outcome:
300 licenses removed.
Value:
€120K.
Now Contract Renewal Tracker can learn:
that the recommendation generated:
real value.
Recommendation Effectiveness
Track:
Recommendation
↓
Accepted
↓
Executed
↓
Outcome
For example:
Recommendation:
Start Negotiation.
Outcome:
€55K cost avoidance.
This creates:
measurable recommendation performance.
Outcome by Recommendation Type
Example:
Review Usage:
€420K value.
Start Negotiation:
€700K.
Evaluate Consolidation:
€310K.
Terminate:
€250K.
This helps determine:
which recommendation rules are most useful.
Next-Best-Action Learning Loop
Recommendation
↓
Human Action
↓
Outcome
↓
Feedback
↓
Better Recommendation
This is the foundation of:
learning renewal intelligence.
Supplier Memory
Outcome data creates:
history.
For Supplier X:
2024:
+8% proposed.
+3% final.
2025:
+12% proposed.
+5% final.
2026:
+10% proposed.
+4% final.
Now future negotiation planning can use:
actual history.
Supplier Negotiation Pattern
The system might eventually say:
Supplier X typically begins 8–12% above the final negotiated position.
This could help:
set expectations.
Contract-Level Renewal History
A contract record could show:
2024
Renewed.
€500K.
2025
Reduced.
€460K.
2026
Renegotiated.
€470K.
This creates:
longitudinal intelligence.
Category-Level Outcomes
Across SaaS:
average supplier proposal increase:
11%.
Average final increase:
5%.
Average quantity reduction:
8%.
This creates:
portfolio benchmarking.
Internal Benchmarking
Compare:
departments.
For example:
IT achieves:
average 6% negotiated reduction from proposal.
Marketing:
2%.
This may indicate:
where procurement support adds value.
Use with caution:
contract mixes differ.
Private Equity Outcome Tracking
At portfolio level:
Company A:
€400K validated savings.
Company B:
€250K.
Company C:
€800K.
Now operating teams can track:
renewal-based value creation.
This connects directly with:
portfolio strategies.
M&A Outcome Tracking
After acquisition:
identified synergy:
€2M.
Validated:
€1.5M.
Contracted:
€1.2M.
Realized:
€900K.
Renewal dates become:
the mechanism for:
synergy realization.
Risk-Avoidance Outcomes
Some results will be:
non-financial.
Example:
critical supplier replacement completed before contract end.
No service disruption.
Outcome:
Continuity Risk Avoided
Do not invent:
a euro amount
unless there is:
a defensible model.
Legal Outcomes
Legal may track:
- termination completed on time;
- notice evidence captured;
- improved liability terms;
- shorter notice period.
Again:
value is broader than:
price.
Outcome Evidence
For every material reported outcome, preserve:
- baseline;
- supplier proposal;
- final agreement;
- quantities;
- calculation;
- approver;
- Finance validation.
This makes:
reporting auditable.
Savings Calculation Record
Example:
Savings Type
Demand Reduction.
Baseline Quantity
1,000.
Renewal Quantity
Unit Cost
€400.
Calculated Value
€120K.
Validated By
Finance.
Evidence
Renewal Order Form.
This is robust.
Audit Trail
If Finance changes:
validated savings
from:
€120K
to:
€100K,
preserve:
both values.
This supports:
governance.
Outcome Disputes
Sometimes Procurement and Finance disagree.
The system should allow:
status:
Disputed
and:
commentary.
Do not force:
one number prematurely.
Outcome Forecasting
Before renewal completes:
show:
expected outcome.
Example:
Current:
€500K.
Expected:
€480K.
Confidence:
Medium.
After signing:
Final:
€490K.
Now:
forecast variance:
+€10K.
This improves:
planning.
Expected Savings Pipeline
Procurement can see:
Potential
€2.4M.
Validated
€1.5M.
Contracted
€900K.
Realized
€650K.
This is a strong management view.
Pipeline Conversion Rates
Potential → Validated.
Validated → Contracted.
Contracted → Realized.
These help identify:
where value is lost.
Example
Potential:
€2M.
Validated:
€1.2M.
Contracted:
€900K.
Realized:
€700K.
Largest leakage:
Potential → Validated.
Maybe:
opportunity estimates are too optimistic.
This creates:
management insight.
Renewal Outcome Score
A future product could calculate:
an outcome score.
But be careful.
A renewal that increases spend may still be:
the correct decision.
For example:
business growth.
Therefore:
do not simply reward:
lower cost.
A better score might consider:
- financial outcome;
- service improvement;
- risk;
- strategic alignment.
This is more complex.
Do Not Gamify Savings Too Aggressively
If buyers are rewarded only for:
savings,
they may:
underbuy,
delay necessary renewals,
or:
ignore quality.
The platform should promote:
optimal outcomes,
not:
lowest price.
Outcome Quality
A strong renewal outcome could be:
higher price
but:
better service,
lower risk,
and:
more flexible terms.
The system should capture:
that context.
Total Renewal Value
Eventually, the platform might present:
several value dimensions:
Financial Value
€120K.
Risk Improvement
High.
Service Improvement
Medium.
Flexibility Improvement
High.
This is more balanced.
Contract Renewal Tracker Beta
For the first beta:
do not build:
complex savings analytics.
Start with:
Previous Annual Value
Renewal Decision
Final Annual Value
Then calculate:
Change vs Previous.
That alone provides:
useful outcome tracking.
Beta Example
Previous:
€100K.
Final:
€92K.
Change:
−€8K.
Decision:
Renew.
Simple.
Useful.
Beta Outcome Fields
I would start with:
- previous value;
- final value;
- decision;
- renewal term;
- completion date.
Then later add:
proposal,
savings type,
validation,
realization.
Post-Beta Phase 1
Add:
Supplier Proposal.
Now:
cost avoidance becomes possible.
Phase 2
Add:
Quantity Before / After.
Now:
demand reduction becomes possible.
Phase 3
Add:
Savings Classification.
Phase 4
Add:
Finance Validation.
Phase 5
Add:
Realization Tracking.
Phase 6
Add:
Outcome Intelligence and Recommendation Learning.
This is a sensible progression.
Contract Renewal Tracker Beta Launch — September 21, 2026
Contract Renewal Tracker is launching its first SaaS beta on September 21, 2026. The beta begins with the structured renewal data needed to understand what happened at each contract decision: current values, owners, notice periods, renewal actions, and eventually final renewal outcomes. As the platform develops, those records can support defensible savings, cost-avoidance, demand-reduction, price-increase, termination-value, and renewal-ROI reporting for Procurement, Finance, and management. [Notify Me When the Beta Launches →] (One launch notification only — no newsletter or ongoing marketing emails.)
Product Positioning Opportunity
Outcome tracking changes the Contract Renewal Tracker value proposition.
Instead of:
Never Miss a Renewal
you can eventually say:
Know What Every Renewal Saved, Cost, or Changed.
That is much stronger for:
Procurement and Finance.
Another Positioning Message
Turn Contract Renewals Into Measurable Financial Outcomes.
Excellent.
Another
From Renewal Decisions to Verified Savings.
Strong.
Another
Track the Financial Result of Every Contract Renewal.
Simple and clear.
Another
Don’t Just Manage Renewals. Measure Their Value.
Very strong marketing language.
Outcome Tracking as a Product Moat
A basic renewal tracker can be copied.
But once Contract Renewal Tracker accumulates:
- historical supplier pricing;
- renewal outcomes;
- negotiation results;
- usage reductions;
- supplier behavior;
the product becomes:
more intelligent over time.
That history becomes:
valuable proprietary customer context.
The Renewal Intelligence Loop
The full loop is now:
Contract
↓
Deadline
↓
Risk
↓
Priority
↓
Recommendation
↓
Workflow
↓
Decision
↓
Outcome
↓
Memory
↓
Better Future Recommendation
This is the core intelligence loop.
Why Outcome Data Is Essential for AI
Without outcomes:
AI can recommend.
But it cannot evaluate:
whether its recommendations were useful.
Outcome tracking creates:
the ground truth.
Example
Recommendation:
Reduce licenses.
Outcome:
€120K saved.
Next year:
high confidence.
Another recommendation:
Consolidate suppliers.
Outcome:
no saving,
project abandoned.
Next year:
lower confidence.
This is how:
the system learns.
Lead Magnet Opportunity
This article is ideal for a:
Contract Renewal Savings & Outcome Tracker
Columns:
- current value;
- supplier proposal;
- final value;
- quantity before;
- quantity after;
- savings type;
- hard savings;
- cost avoidance;
- demand reduction;
- avoided commitment;
- validated value;
- realized value.
This could be extremely useful for:
Procurement and Finance.
Download the Contract Renewal Savings & Outcome Tracker
Measure the financial result of every renewal using structured fields for current spend, supplier proposals, final contract values, quantity changes, hard savings, cost avoidance, demand reduction, terminated spend, and realized value.
Download the Free Outcome Tracking Template →
Second Lead Magnet
Another useful asset:
Contract Renewal Savings Methodology Guide
Define:
Hard Savings.
Cost Avoidance.
Demand Reduction.
Spend Elimination.
Realized Savings.
This addresses:
a common Procurement/Finance problem.
Interactive ROI Tool
Eventually create:
Contract Renewal ROI Calculator
Inputs:
Annual Renewal Spend.
Platform Cost.
Hard Savings.
Avoided Renewals.
Administrative Time Saved.
Outputs:
Value-to-Cost Ratio.
Payback.
This can become:
a strong commercial conversion tool.
Example
Annual renewal spend:
€10M.
Hard savings:
€100K.
Cost avoidance:
€150K.
Platform:
€4K.
Direct value-to-cost:
62.5×.
Again:
show categories separately.
Final Thoughts
Contract renewal management should ultimately answer:
three questions.
1. What did we decide?
Renew.
Reduce.
Replace.
Terminate.
2. What changed commercially?
Price.
Quantity.
Term.
Scope.
Supplier.
3. What value was actually created?
Hard savings.
Cost avoidance.
Demand reduction.
Avoided commitment.
Service improvement.
The strongest renewal organizations do not stop at:
workflow completion.
They measure:
outcomes.
That changes Contract Renewal Tracker from:
a control system
into:
a value-measurement system.
The progression becomes:
We know what is renewing.
Then:
We know what to do.
Then:
We know what happened.
And finally:
We know which actions consistently create the best results.
That final stage is where renewal data becomes:
true renewal intelligence.
Next Article in the Contract Renewal Tracker Series
The next article should go much deeper into the financial methodology itself: baseline selection, recurring vs one-time savings, annualization, multi-year contracts, inflation, quantity changes, double-counting prevention, Finance validation, realization tracking, and audit evidence. This would create an especially strong Procurement/Finance pillar page and could directly support a future Savings module inside Contract Renewal Tracker.

