Contract renewal management has a direct impact on budgeting.
Every renewal can change:
- annual operating expense;
- committed spend;
- supplier inflation;
- payment timing;
- department budgets;
- multi-year obligations;
- expected savings.
Yet many finance teams still discover renewal-driven cost changes relatively late.
A supplier proposes a 12% increase.
A business unit renews more licenses than expected.
A three-year agreement creates a larger commitment than finance anticipated.
A planned termination slips into the next financial year.
Those events can create budget variance.
A dedicated Contract Renewal Tracker can give finance a forward-looking view of recurring supplier commitments before contracts are finalized.
The objective is to answer:
What is likely to renew, at what cost, how confident are we, and how will those decisions affect future budgets?
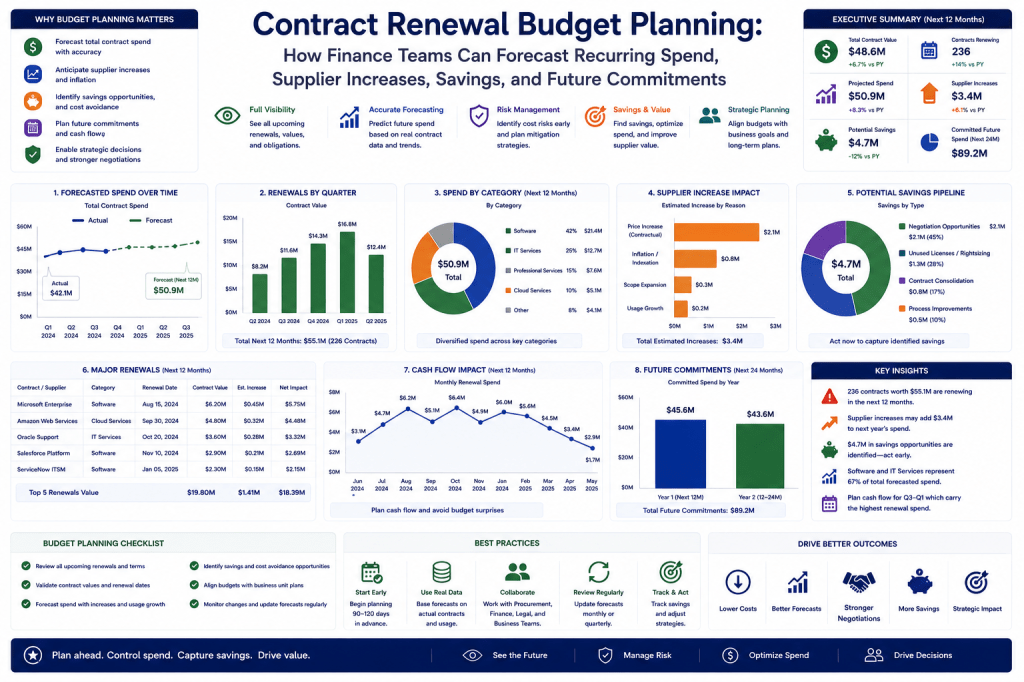
Why Contract Renewals Belong in Budget Planning
Recurring supplier spend is not static.
A €500,000 contract today may become:
€550,000 next year.
Or:
€420,000 after optimization.
Or:
€0 after termination.
The finance forecast should reflect those likely outcomes before the contract is signed.
Otherwise, budgeting becomes reactive.
Still Forecasting Supplier Spend from Last Year’s Numbers?
Last year’s recurring spend is a useful starting point.
It is not a renewal forecast.
Contract Renewal Tracker can combine upcoming renewals, supplier proposals, business decisions, procurement expectations, savings opportunities, and multi-year terms to give finance a more realistic view of future contractual spend.
Turn renewal decisions into forward-looking budget intelligence →
Start with the Current Run Rate
The first financial view should answer:
What are we spending today?
For example:
Current annualized supplier spend:
€40M
This becomes the baseline.
Then finance can layer upcoming renewal changes on top.
Current Contract Value vs Actual Run Rate
A contract may state:
€500K.
But ERP data may show:
€560K annualized spend.
Budget planning should understand the difference.
Possible causes include:
- usage;
- add-ons;
- overages;
- scope changes.
The renewal forecast should use the most appropriate baseline.
Renewal Forecast Horizon
Finance may need several time horizons:
12 Months
Annual budget planning.
24 Months
Medium-term planning.
36 Months
Multi-year commitment visibility.
Contract Renewal Tracker can support all three.
12-Month Renewal View
For example:
Contracts renewing:
Current annual value:
€38M.
This tells finance how much recurring spend may change during the next budget cycle.
24-Month View
The 24-month horizon helps identify:
- major strategic renewals;
- replacement projects;
- long-term inflation exposure.
This gives finance more time to prepare.
36-Month View
For large enterprises, three-year visibility matters because many renewals create:
multi-year commitments.
The platform can show:
Annual P&L Impact
and:
Total Contract Commitment
separately.
Budget Planning Metric 1: Renewing Spend
A core metric:
Current Annual Spend Associated with Contracts Renewing During Period
For example:
Next 12 months:
€32M.
Next 24 months:
€58M.
Next 36 months:
€82M.
This gives finance the exposure base.
Budget Planning Metric 2: Expected Renewal Spend
Current spend is not necessarily future spend.
For each contract, estimate:
Expected Renewal Value
For example:
Current:
€500K.
Expected:
€520K.
Forecast increase:
€20K.
Then aggregate across the portfolio.
Expected Spend Calculation
A basic portfolio might show:
Current renewing spend:
€30M.
Expected renewed spend:
€31.6M.
Expected increase:
€1.6M
This creates a forward-looking financial view.
Budget Planning Metric 3: Supplier Proposal Exposure
Supplier proposals provide another scenario.
For example:
Current:
€30M.
Supplier proposals:
€33M.
Gross proposed increase:
€3M
Procurement expects to negotiate that down.
Finance can see the difference between:
Supplier Ask
and:
Expected Outcome
Proposed vs Expected vs Target
A strong budget view includes:
Supplier Proposal
€33M.
Procurement Expected
€31.6M.
Procurement Target
€30.8M.
This gives finance a range rather than one false-precision number.
Scenario Planning
These can become:
Downside
Supplier proposal.
Expected
Likely outcome.
Target
Optimized outcome.
This is useful for financial planning.
Example Scenario
Current spend:
€20M.
Supplier proposal scenario:
€22M.
Expected:
€21M.
Target:
€20.4M.
Finance now understands the potential range:
€1.6M
between target and downside.
Budget Planning Metric 4: Committed Spend
Some future spend is already certain.
For example:
renewal approved
and:
contract signed.
That should be classified:
Committed
This is higher-confidence budget data.
Committed vs Forecast
Example:
Next-year supplier spend:
Signed / Committed
€18M.
Approved, Not Signed
€5M.
Negotiating
€7M.
Undecided
€4M.
Total expected portfolio:
€34M.
This helps finance understand uncertainty.
Budget Planning Metric 5: Undecided Spend
One of the most important finance metrics is:
Undecided Renewal Value
For example:
€4M of annual spend
has no confirmed renewal strategy.
That represents forecast uncertainty.
Why Undecided Spend Matters
If the organization later decides:
Terminate,
forecast drops.
If it decides:
Renew +10%,
forecast rises.
Finance should know how much of the budget is still exposed to decisions.
Decision Coverage
A useful KPI:
Upcoming Renewal Spend with Defined Strategy ÷ Total Upcoming Renewal Spend
For example:
€28M / €32M
=
87.5%
Finance may target higher decision coverage as the budget deadline approaches.
Decision Coverage by Horizon
For example:
180 days out:
75%.
90 days:
90%.
30 days:
98%.
This can become part of financial planning discipline.
Budget Planning Metric 6: Supplier Inflation
Supplier price increases can materially affect budgets.
For example:
Software:
+8%.
Cloud:
+7%.
Professional Services:
+5%.
Telecom:
+3%.
These increases can be weighted across the renewal portfolio.
Weighted Supplier Inflation
Suppose:
€10M software at 8%.
€5M cloud at 7%.
€5M services at 5%.
Weighted expected increase:
approximately:
6.75%
Finance can compare this with budget assumptions.
Proposed Inflation vs Negotiated Inflation
For example:
Supplier proposals:
9%.
Expected final:
4.5%.
Budget assumption:
4%.
Remaining risk:
0.5 percentage point.
This helps finance understand procurement’s contribution.
Budget Planning Metric 7: Savings Forecast
Upcoming renewals may also reduce spend.
Examples:
- license reductions;
- supplier negotiation;
- termination;
- consolidation.
Finance should incorporate:
Validated Expected Savings
into the forecast.
Savings Pipeline
For example:
Identified:
€2M.
Business Validated:
€1.4M.
Negotiating:
€900K.
Contracted:
€600K.
Finance should not treat all €2M as certain.
Probability-Weighted Savings
Possible weighting:
Validated:
50%.
Negotiating:
75%.
Contracted:
100%.
Example:
€500K validated × 50%
=
€250K.
€400K negotiating × 75%
=
€300K.
€300K contracted
=
€300K.
Weighted savings forecast:
€850K
This is more realistic than simply adding pipeline totals.
Budget Planning Metric 8: Termination Savings
If a contract is planned for termination:
finance may forecast reduced spend.
But timing matters.
Example
Annual contract:
€240K.
Ends:
June 30.
Next financial year begins:
January 1.
Current-year savings:
6 months
=
approximately:
€120K.
Next full-year savings:
€240K.
Both values should be shown.
Budget Planning Metric 9: Replacement Economics
Replacing a supplier may reduce long-term spend but increase Year 1 costs.
For example:
Old supplier:
€600K.
New:
€400K.
Migration:
€300K.
Year 1:
€700K.
Year 2:
€400K.
Finance needs the multi-year view.
Replacement Budget Profile
Year 1
+€100K vs incumbent due to migration.
Year 2
−€200K.
Year 3
−€200K.
Three-year net benefit:
€300K.
This is very different from simply saying:
replacement saves €200K annually.
Budget Planning Metric 10: Bridge Extension Cost
If replacement slips:
a temporary extension may be required.
That can create unplanned spend.
For example:
Three-month bridge:
€180K.
This should appear in forecast as soon as the transition risk is recognized.
Transition Risk Should Affect Financial Forecast
If:
replacement go-live is at risk,
finance should see:
Potential Bridge Cost
This links operational and financial planning.
Budget Planning Metric 11: Multi-Year Contract Commitments
A renewal may have modest annual spend but create a large total obligation.
Example:
Annual:
€800K.
Term:
5 years.
Total commitment:
€4M
Finance and executive leadership need this visibility.
Annual Spend vs Total Commitment
The dashboard should show:
Annual Budget Impact
€800K.
Total Contract Value
€4M.
These answer different questions.
Future Committed Spend Schedule
For example:
2027
€800K.
2028
€824K.
2029
€849K.
2030
€874K.
2031
€900K.
This reflects escalation.
Contracted Escalation Forecast
If annual increase is:
3%,
future years can be calculated automatically.
This gives finance more accurate multi-year planning.
Budget Planning Metric 12: Payment Timing
Two contracts with identical annual value can have different cash-flow profiles.
Example:
Supplier A:
€1.2M annual upfront.
Supplier B:
€100K monthly.
P&L may be similar.
Cash-flow impact differs.
Payment Schedule Forecast
The tracker can capture:
- annual;
- quarterly;
- monthly.
Then finance can model cash requirements.
Upfront Payment Exposure
For example:
January supplier renewals require:
€8M upfront payments.
This is useful treasury information.
Budget Planning Metric 13: Cost Centers
Each contract should ideally map to:
- department;
- cost center.
Finance can forecast renewal impact at the right organizational level.
Cost-Center Forecast Example
IT Infrastructure
Current:
€12M.
Expected:
€13M.
Variance:
+€1M.
Marketing
Current:
€4M.
Expected:
€3.7M.
Variance:
−€300K.
This gives budget owners clear visibility.
Budget Planning Metric 14: Department Allocation
Some contracts serve several departments.
The cost may need allocation.
For example:
Enterprise software:
€1M.
IT:
40%.
Finance:
30%.
Sales:
30%.
Renewal changes can then flow into each department’s budget.
Allocation Model
Possible allocation bases:
- users;
- headcount;
- consumption.
This can make budget impact more accurate.
Budget Planning Metric 15: Legal Entity
Global organizations may need forecasts by:
- legal entity.
For example:
Netherlands BV:
€8M.
Germany GmbH:
€5M.
UK Ltd:
€4M.
This supports local planning.
Budget Planning Metric 16: Currency
Contract spend may be:
USD.
GBP.
EUR.
Finance must understand original currency and consolidated reporting currency separately.
FX Exposure
For example:
USD-denominated renewing spend:
$10M.
Even if supplier pricing does not change, exchange-rate movement can affect EUR budget.
Contract Renewal Tracker can identify currency exposure.
Keep FX Assumptions Separate from Supplier Inflation
Supplier increase:
5%.
FX impact:
3%.
These are different drivers.
The forecast should not merge them into one unexplained variance.
Budget Bridge Analysis
A useful CFO view explains:
Current Spend
↓
Supplier Inflation
↓
Demand Changes
↓
Negotiated Savings
↓
Terminations
↓
New Contracts
↓
Expected Future Spend
This is a financial bridge.
Example Budget Bridge
Current:
€40M.
Supplier Increases:
+€2.4M.
Demand Growth:
+€600K.
Hard Savings:
−€900K.
Terminations:
−€500K.
Expected:
€41.6M
Now finance understands why spend changes.
Variance Explanation Matters
A forecast saying:
Next year:
€41.6M
is useful.
A forecast explaining:
why it moved from €40M
is much more useful.
Budget Variance
Compare:
Approved Budget:
€41M.
Expected Renewal Spend:
€41.6M.
Variance:
+€600K
This becomes an intervention signal.
Budget Variance by Department
For example:
IT:
+€800K.
Marketing:
−€300K.
Operations:
+€100K.
Net:
+€600K.
Finance can focus on IT.
Budget Variance by Supplier
Supplier A:
+€400K.
Supplier B:
+€200K.
Supplier C:
−€100K.
This helps explain pressure.
Budget Variance by Driver
Example:
Price Inflation:
+€1M.
Volume Growth:
+€400K.
Savings:
−€600K.
This gives management a clearer story.
Budget Gap Management
Suppose:
Target budget:
€40M.
Expected:
€41.6M.
Gap:
€1.6M.
Procurement and business owners can identify additional optimization opportunities.
Renewal Optimization as a Budget Lever
The system can ask:
Which upcoming renewals could help close the €1.6M gap?
This creates direct finance-procurement collaboration.
AI Budget Optimization Query
A CFO could ask:
Where can we realistically reduce €500K from upcoming renewals?
The assistant might identify:
- unused SaaS licenses;
- high supplier increases;
- termination candidates.
This is a strong cross-functional use case.
Budget Scenario 1: Base Case
For example:
Expected:
€41.6M.
This uses current likely outcomes.
Budget Scenario 2: Downside
Assume:
- supplier proposals accepted;
- savings underperform.
Forecast:
€43M.
This helps finance understand risk.
Budget Scenario 3: Optimization
Assume:
- target negotiations achieved;
- validated savings realized.
Forecast:
€40.8M.
Now leadership sees the potential range.
Scenario Table
| Scenario | Expected Spend |
|---|---|
| Optimization | €40.8M |
| Base | €41.6M |
| Downside | €43.0M |
Range:
€2.2M
This is useful for planning.
Scenario Assumptions Should Be Visible
Do not present scenarios without explaining:
- supplier increase;
- savings conversion.
This keeps forecasting credible.
Probability-Weighted Renewal Outcomes
Some contracts remain uncertain.
For example:
Renew
60%.
Expected spend:
€500K.
Reduce
25%.
Spend:
€400K.
Terminate
15%.
Spend:
€0.
Probability-weighted expected spend:
€400K.
This can improve portfolio forecasts.
Calculation
0.60 × €500K
0.25 × €400K
0.15 × €0
=
€400K
This is more nuanced than assuming full renewal.
Use Probability Carefully
Probabilities should have clear sources:
- owner estimate;
- workflow stage;
- historical model.
Do not pretend the forecast is certain.
Forecast Confidence
Every budget forecast should include:
confidence
For example:
High-confidence value:
€28M.
Medium:
€9M.
Low:
€4.6M.
This tells finance how stable the forecast is.
Confidence Drivers
High confidence:
- signed;
- approved;
- final pricing.
Low confidence:
- decision unresolved;
- supplier proposal missing.
This is straightforward and explainable.
Forecast Confidence Should Improve Over Time
For example:
At 180 days:
70%.
At 90:
85%.
At 30:
97%.
This demonstrates increasing financial certainty.
Budget Freeze Dates
Finance may need renewal decisions before:
annual planning deadlines.
For example:
Budget submission:
October 1.
The tracker can prioritize contracts whose unresolved outcomes materially affect the budget.
Budget-Critical Renewals
Suppose:
12 contracts
represent:
€8M
of next-year uncertainty before budget submission.
The system can flag:
Budget-Critical Decisions Required
This is highly useful to CFO teams.
Budget Planning Calendar
Contract Renewal Tracker can align:
renewal workflows
with:
financial planning cycles.
For example:
180 days before budget freeze:
forecast generated.
90 days:
decision coverage target.
30 days:
final exceptions reviewed.
This creates a recurring finance process.
Rolling Forecasts
Finance increasingly uses:
rolling forecasts
rather than one annual budget.
Renewal data fits well into this model because contract outcomes change throughout the year.
The system can refresh:
monthly
or:
quarterly.
Forecast Versioning
Store:
January forecast.
April forecast.
July forecast.
Then measure:
how expectations changed.
Forecast Movement
For example:
January:
€40.5M.
April:
€41.1M.
July:
€41.6M.
Finance can ask:
Why did forecast increase €1.1M?
The system can explain the drivers.
Forecast Change Drivers
Possible:
- supplier proposal increased;
- termination delayed;
- volume increased;
- savings slipped.
This turns forecasting into analysis.
Forecast Accuracy
After the period closes:
compare:
Forecast:
€41.6M.
Actual:
€42M.
Variance:
0.96%.
This measures model quality.
Forecast Accuracy by Horizon
90-day forecast:
98%.
180-day:
94%.
365-day:
85%.
This helps finance understand reliability.
Forecast Accuracy by Category
Software:
92%.
Cloud:
85%.
Telecom:
98%.
Cloud forecasts may need better consumption data.
Forecast Bias
If the system consistently:
underestimates supplier increases,
finance should adjust assumptions.
This is another maturity metric.
Budget Planning and Savings Accuracy
Likewise:
forecast savings:
€2M.
realized:
€1.5M.
Savings conversion:
75%.
Future forecasts can be weighted accordingly.
Renewal Budget Dashboard
A CFO dashboard might show:
Current Annual Supplier Spend
€40M.
Renewing Next 12 Months
€32M.
Expected Renewal Spend
€33.1M.
Budget
€32.5M.
Forecast Variance
+€600K.
Undecided Spend
€3.2M.
Weighted Savings
€1.1M.
Supplier Increase Exposure
€2.8M.
This is an executive financial control view.
Finance Work Queue
Finance users may also need:
Approvals Pending
€8M.
Budget Exceptions
€1.2M.
Multi-Year Commitments
€12M.
Forecast Decisions Missing
This turns Contract Renewal Tracker into an operational finance tool.
Department Budget Dashboard
A budget owner could see:
Current Contract Spend
€4.2M.
Expected Next Year
€4.6M.
Variance
+€400K.
Biggest Driver
SaaS increase.
Optimization Opportunities
€180K.
This gives the business owner accountability.
Procurement Budget View
Procurement may see:
Supplier Proposal Exposure
Negotiation Target
Expected Outcome
This connects procurement negotiations with finance plans.
Legal Budget Impact
Legal may not manage the budget directly.
But delayed termination notice or approval can have financial impact.
For example:
Delayed termination may add €250K to next-year spend.
This makes legal deadlines financially visible.
Budget Impact Alerts
Useful alerts include:
Expected renewal spend exceeded budget by 5%.
Supplier proposal adds €500K beyond forecast.
Planned termination slipped into next financial year.
Savings forecast declined €200K.
These are decision-relevant.
Budget Guardrails
For example:
IF expected_renewal_spend > budget * 1.05THEN finance_review_required = TRUE
This creates proactive control.
Budget Gap Alert
IF forecast_savings_gap > 500000THEN notify_procurement_lead
This aligns cost optimization with finance targets.
AI-Generated Budget Brief
Before a CFO review:
Next-Year Renewal Forecast
Current renewing spend:
€32M.
Expected:
€33.1M.
Budget:
€32.5M.
Variance:
+€600K.
Main Drivers:
- SaaS inflation +€900K.
- Cloud growth +€500K.
- validated savings −€800K.
Undecided:
€3.2M.
This is concise and decision-ready.
Ask AI: Why Are We Over Budget?
The assistant might answer:
Approximately €900K of the variance comes from software suppliers proposing increases above budget assumptions, partially offset by €300K of additional license-reduction savings. Three large renewals remain undecided and could still materially change the forecast.
This is much more useful than manually analyzing spreadsheets.
Ask AI: Which Renewals Could Change the Forecast Most?
For example:
The five highest-impact unresolved renewals represent €4.8M of annual spend. ExampleCloud alone could move the forecast by approximately €400K depending on negotiation outcome.
This helps finance focus.
Ask AI: What Happens If Savings Fall Short?
The assistant can run:
scenario analysis.
For example:
If only 60% of currently weighted savings are realized, expected renewal spend rises by approximately €380K.
This gives finance downside visibility.
Ask AI: What Happens If Supplier Inflation Is 2 Points Higher?
For example:
A 2-percentage-point increase across remaining unresolved renewals would increase annual spend by approximately €520K.
This supports sensitivity analysis.
Ask AI: Where Can We Close the Budget Gap?
The assistant could identify:
high-confidence optimization opportunities.
This connects budget pressure to actionable renewals.
AI Should Separate Facts from Assumptions
For example:
Verified
Signed commitments:
€18M.
Forecast Assumption
Unresolved SaaS renewals expected at +4%.
This maintains transparency.
AI Should Expose Confidence
For example:
Forecast confidence is Medium because €3.2M of renewal value remains undecided.
Again, uncertainty should be visible.
Budget Planning and ERP Integration
ERP provides:
actual spend.
Contract Renewal Tracker provides:
future renewal outcomes.
Together they create:
current + forward-looking financial visibility.
Budget Planning and FP&A Integration
A future integration could push:
expected renewal spend
into:
FP&A systems.
This reduces manual budget updates.
Budget Planning and Contract Data
The forecast becomes more accurate when contract metadata includes:
- renewal dates;
- escalations;
- payment schedules.
This is another reason data quality matters.
Budget Planning and Transition Management
Replacement projects influence:
- migration costs;
- bridge costs.
These need to flow into financial forecasts.
Budget Planning and Supplier Consolidation
Consolidation initiatives may create:
future savings.
But until implementation is validated, they should remain:
forecast
rather than:
committed reductions.
Budget Planning and Supplier Scorecards
Supplier underperformance may increase likelihood of:
replacement.
That can change future spend and transition costs.
All these modules reinforce one another.
Budget Planning and Decision Management
The budget forecast improves as:
Renew / Reduce / Replace / Terminate
decisions become explicit.
This is one of the strongest arguments for structured renewal decisions.
Budget Planning KPIs
Useful metrics include:
Expected Renewal Spend
Budget Variance
Supplier Inflation
Undecided Spend
Decision Coverage
Committed Spend
Weighted Savings
Forecast Confidence
Forecast Accuracy
These give finance a complete renewal scorecard.
Budget Variance Trend
For example:
January:
+€2M.
April:
+€1.2M.
July:
+€600K.
This shows procurement and business optimization closing the gap.
Undecided Spend Trend
€6M → €3.2M → €1M.
This demonstrates improving forecast certainty.
Supplier Inflation Trend
Proposed:
9%.
Final:
4%.
Finance can quantify negotiation impact.
Savings Contribution
Budget increase without optimization:
€3M.
Savings:
€2.4M.
Net increase:
€600K.
This tells a clear financial story.
Renewal Forecast ROI
Better forecast accuracy can itself create value.
Finance can:
- avoid unexpected budget overruns;
- plan cash.
The value may be difficult to quantify directly, but operational impact can be substantial.
The Larger Financial ROI Is Spend Intervention
The stronger business case remains:
the platform identifies:
where spend can be changed before the budget becomes committed.
That is more valuable than simply reporting variance afterward.
One Better Renewal Decision Can Move the Budget Materially
Example:
Planned:
€1M renewal.
Business review reduces:
€200K.
That directly improves:
next-year budget.
This makes the link between Contract Renewal Tracker and financial planning very tangible.
Contract Renewal Tracker as a Financial Planning Layer
This is another important product evolution.
A basic tracker answers:
When does the contract renew?
A financial renewal platform asks:
How will this renewal affect next year’s budget, future commitments, and cost-reduction targets?
That greatly broadens the buyer audience.
From Contract Dates to Budget Intelligence
The lifecycle becomes:
Current Spend
↓
Upcoming Renewals
↓
Supplier Proposals
↓
Business Decisions
↓
Procurement Forecast
↓
Savings
↓
Expected Future Spend
↓
Budget
This connects contract operations directly to finance.
Ready to See Renewal Costs Before They Hit the Budget?
Finance should not have to wait until contracts are signed to discover what recurring supplier spend will look like next year.
Contract Renewal Tracker is designed to give finance teams a forward-looking view of renewal-driven cost changes while there is still time to intervene.
Use Contract Renewal Tracker to:
- forecast 12-, 24-, and 36-month renewal spend;
- compare current spend with supplier proposals;
- model expected and target outcomes;
- track committed versus undecided spend;
- forecast supplier inflation;
- incorporate weighted savings;
- model terminations and replacements;
- track migration and bridge costs;
- calculate multi-year commitments;
- forecast payment timing;
- allocate spend by cost center and department;
- measure budget variance;
- run scenario analysis;
- track forecast confidence and accuracy;
- use AI to explain budget changes and identify renewals that can close cost gaps.
The objective is to move from:
“We will find out what these contracts cost when they renew.”
to:
“We already know the likely financial range, where the uncertainty sits, and which renewal decisions can still improve the budget outcome.”
Start Your Contract Renewal Tracker Subscription →
Final Thoughts
Recurring supplier spend should not enter the financial plan as a simple copy of last year’s number.
Every major renewal creates the possibility of:
Inflation
Growth
Savings
Termination
Replacement
New Commitment
A strong renewal budget process models those changes before they become contractual obligations.
The financial flow becomes:
Current Run Rate
↓
Renewal Exposure
↓
Expected Outcome
↓
Savings / Cost Increases
↓
Future Commitment
↓
Budget Impact
For Contract Renewal Tracker, this creates another strong product position:
The platform can help finance understand not only when contracts renew, but how those renewals are likely to reshape recurring spend before the next budget is locked.
That makes the software relevant not only to procurement and contract teams, but directly to CFOs, FP&A, finance directors, and budget owners.
Next Article in the Contract Renewal Tracker Series
The next article will focus on a finance problem that becomes important with shared enterprise agreements. It will cover user-based allocation, consumption-based chargeback, headcount allocation, fixed-percentage models, regional allocations, legal-entity splits, cost-center mapping, budget ownership, allocation changes after renewal, shared savings attribution, invoice reconciliation, and AI-assisted allocation anomaly detection.
This will further strengthen the finance use case by showing how Contract Renewal Tracker can connect enterprise-wide supplier contracts to the actual teams that consume and budget for them.

