Enterprise contracts are often shared.
One supplier agreement may support:
- several departments;
- multiple business units;
- different countries;
- several legal entities;
- hundreds or thousands of users.
That creates a finance problem.
The contract may have one total annual value, but the cost needs to be distributed across the parts of the organization that actually consume the service.
If that allocation is inaccurate, finance can struggle with:
- budget ownership;
- chargeback;
- cost-center reporting;
- renewal forecasting;
- savings attribution.
A dedicated Contract Renewal Tracker can connect shared contract costs to the organizational units that consume them and automatically update those allocations when a renewal changes quantity, pricing, scope, or supplier terms.
The key question becomes:
Who should carry what portion of the contract cost—and how should that change when the contract renews?
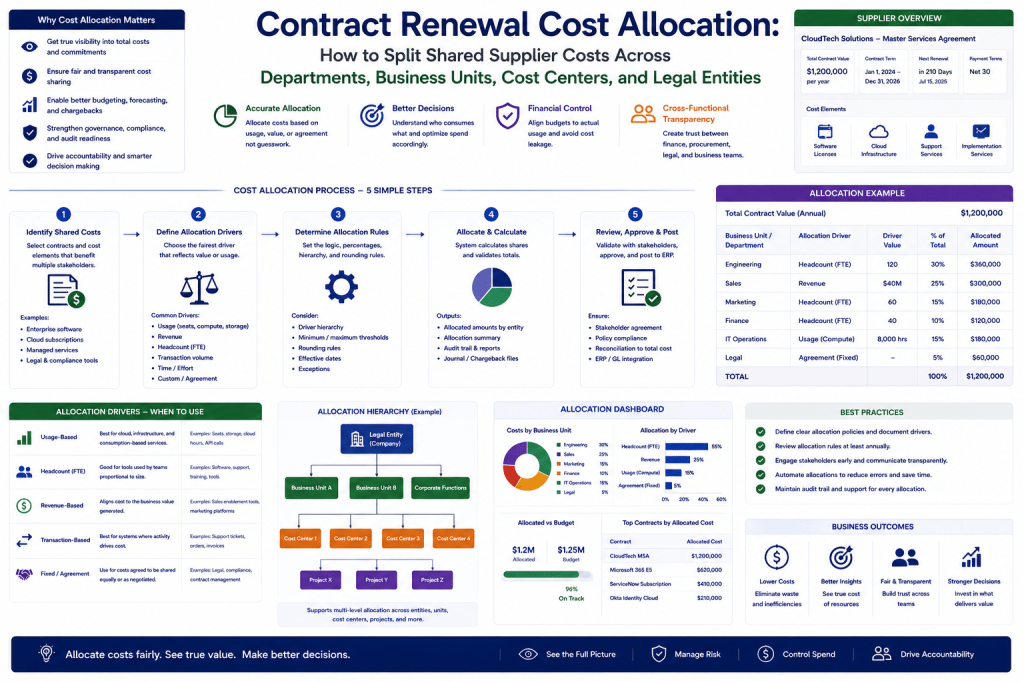
What Is Contract Renewal Cost Allocation?
Contract cost allocation is the process of distributing the financial value of a shared contract across the teams, entities, or cost centers that benefit from it.
A €1 million enterprise agreement might be allocated across:
- IT;
- Finance;
- Sales;
- Marketing.
Or across:
- Netherlands;
- Germany;
- France;
- UK.
Or through a combination of both.
The objective is to align:
Contract Cost
with:
Organizational Consumption and Budget Responsibility
One Contract. Ten Departments. Who Owns the Spend?
Shared enterprise agreements often have one supplier invoice but many internal consumers.
Contract Renewal Tracker can connect renewal costs, users, consumption, cost centers, and organizational ownership so finance knows where future spend should actually land.
Turn shared contract spend into transparent internal budget allocations →
Why Cost Allocation Matters Before Renewal
Suppose:
Enterprise software contract:
€1.2M.
Current allocation:
IT:
50%.
Finance:
20%.
Sales:
20%.
Marketing:
10%.
At renewal, user distribution changes.
If finance simply reuses the old percentages, departmental budgets may become inaccurate.
The renewal is a natural point to validate the allocation.
Allocation Method 1: Fixed Percentage
The simplest approach is to define fixed percentages.
For example:
IT:
40%.
Finance:
30%.
Sales:
20%.
HR:
10%.
Total:
100%.
This is easy to administer.
When Fixed Percentage Works
It works best when:
- usage is stable;
- exact consumption is difficult to measure;
- departments agree on the methodology.
It is less suitable when usage changes rapidly.
Fixed Allocation Example
Contract:
€1M.
IT
40% = €400K.
Finance
30% = €300K.
Sales
20% = €200K.
HR
10% = €100K.
This becomes the internal budget distribution.
Allocation Method 2: User-Based Allocation
For many SaaS products, allocated users provide a stronger basis.
Suppose:
Total users:
2,000.
Finance:
Sales:
Marketing:
HR:
Allocation follows user count.
User-Based Formula
Department Users ÷ Total Users × Contract Cost
For Sales:
900 ÷ 2,000 × €1M
=
€450K
This can be calculated automatically.
Why User-Based Allocation Can Be Better
It reflects actual entitlement or deployment.
If Sales grows:
its allocation grows.
If Marketing reduces licenses:
its budget burden falls.
This creates better accountability.
Assigned Users vs Active Users
A key question is:
Should allocation use:
assigned licenses
or:
active users?
Assigned users may reflect contractual demand.
Active users may reflect actual consumption.
The correct choice depends on finance policy.
Example
Department A:
Assigned:
Active:
Department B:
Assigned:
Active:
A 50/50 allocation based on assigned licenses may not reflect actual usage.
Using active users would shift more cost to Department B.
Hybrid User Allocation
An organization might use:
70% based on assigned users
and:
30% based on active usage.
This can balance entitlement and actual consumption.
Allocation Method 3: Consumption-Based
Some contracts are better allocated based on actual consumption.
Examples include:
- cloud;
- telecom;
- data services.
For example:
Cloud Contract:
€2M.
Business Unit A consumes:
45%.
B:
35%.
C:
20%.
Then cost allocation follows usage.
Consumption-Based Allocation
If actual spend is measured directly per unit:
allocation can be very precise.
For example:
Compute hours.
Storage.
API calls.
Transactions.
This supports chargeback models.
Cloud Example
Total cloud consumption:
€1.8M.
Division A:
€900K.
Division B:
€540K.
Division C:
€360K.
Allocation:
50% / 30% / 20%.
If contract cost is:
€2M,
those same percentages can allocate the committed cost.
Allocation Method 4: Headcount
For enterprise-wide services such as:
- HR platforms;
- collaboration tools;
- security tooling;
headcount may be a reasonable proxy.
Suppose:
Company Headcount:
5,000.
Europe:
2,500.
US:
1,500.
APAC:
1,000.
A €500K contract could allocate:
€250K / €150K / €100K.
Headcount Is a Proxy
It may not reflect actual service usage.
But it can be:
simple
and:
predictable.
That may be more important for budgeting than perfect precision.
Allocation Method 5: Revenue
Some shared business services may be allocated based on revenue contribution.
For example:
Corporate service contract:
€1M.
Business Unit A:
50% of revenue.
B:
30%.
C:
20%.
Allocation follows those percentages.
This is more common in internal finance models than direct contract management.
Allocation Method 6: Transaction Volume
For platforms used in operational processing:
cost can be allocated based on:
- orders;
- payments;
- tickets;
- API calls.
This may provide a closer relationship between usage and cost.
Allocation Method 7: Equal Split
For small shared contracts:
an equal split may be sufficient.
For example:
4 departments.
Annual contract:
€40K.
Each:
€10K.
Do not overengineer allocation for low-value spend.
Allocation Method 8: Direct + Shared
Some contracts contain both:
directly attributable costs
and:
shared costs.
For example:
Enterprise license:
€600K.
Premium module for Finance:
€100K.
Premium module for Sales:
€200K.
Shared platform:
€300K.
The €300K can then be distributed using another methodology.
Direct Cost First
A strong allocation process generally assigns:
directly identifiable cost first
Then distributes:
shared residual cost.
This produces a more defensible model.
Example
Total:
€1M.
Direct Finance Module:
€200K.
Direct Sales Module:
€300K.
Shared Platform:
€500K.
Then allocate shared €500K by users.
This avoids forcing everything through one arbitrary ratio.
Allocation Hierarchies
Large organizations may need multiple levels.
For example:
Global Contract
↓
Region
↓
Business Unit
↓
Cost Center
The system can cascade allocations.
Example Hierarchy
€4M global software contract.
Europe
50% = €2M.
Within Europe:
Germany:
40%.
France:
30%.
Netherlands:
30%.
This creates precise internal budgeting.
Legal Entity Allocation
For multinational contracts, spend may need to be split across:
- legal entities.
This matters for:
- budgeting;
- intercompany charges;
- invoice routing.
The allocation should preserve entity ownership.
Example
Global Contract:
€5M.
Entity A:
€2M.
Entity B:
€1.5M.
Entity C:
€1.5M.
Finance can then plan local budgets appropriately.
Contracting Entity vs Consuming Entity
These are often different.
For example:
Netherlands BV signs the contract.
But:
Germany and France consume the service.
The system should distinguish:
Legal Contracting Entity
from:
Cost Allocation Entities
This is essential in international organizations.
Cost Center Mapping
Each allocation should connect to:
Cost Center
For example:
IT Infrastructure:
CC-1001.
Sales Operations:
CC-2040.
Marketing:
CC-3100.
This enables ERP and FP&A integration.
Cost Center Ownership
The system can also track:
- budget owner.
That creates clear accountability for renewal impact.
Allocation Validation Before Renewal
Before a shared contract renews:
ask each cost owner to confirm:
Users
Expected Consumption
Budget Ownership
This updates the forecast.
Cost Allocation Review Workflow
A typical process might be:
Renewal Window Opens
↓
Current Allocation Loaded
↓
Usage / Headcount Updated
↓
Cost Owners Review
↓
Future Allocation Calculated
↓
Finance Approves
This creates a controlled annual process.
Allocation Review Does Not Need Every Department for Every Contract
For low-value contracts:
automate.
For strategic enterprise agreements:
require confirmation.
This keeps the process proportionate.
Allocation Change at Renewal
Suppose:
Current contract:
€1M.
Current Sales allocation:
40%.
New user distribution:
Sales now 50%.
New contract:
€1.1M.
Sales budget becomes:
€550K.
That is a significant change from:
€400K.
Finance should see it early.
Budget Impact by Department
This is one of the most useful outputs.
For example:
| Department | Current | Renewal | Change |
|---|---|---|---|
| IT | €400K | €330K | −€70K |
| Sales | €400K | €550K | +€150K |
| Marketing | €200K | €220K | +€20K |
Now finance can explain budget movements.
Allocation Variance
The system can calculate:
New Allocation − Current Allocation
For Sales:
+€150K.
This can trigger:
Budget Owner Review
Allocation Impact Should Be Visible Before Approval
A CFO should not approve:
€1.1M enterprise renewal
without knowing:
which departments will absorb the cost.
This should be part of the approval brief.
Finance Approval Brief
For example:
Total Contract
€1.1M.
Sales
€550K.
IT
€330K.
Marketing
€220K.
Largest Allocation Change
Sales +€150K.
This provides better decision context.
Allocation Method Changes
The organization may also change methodology.
For example:
Old:
fixed percentage.
New:
active-user-based.
That can create large budget shifts.
The system should preserve both:
Method
and:
Reason
Allocation Method Audit Trail
For example:
2028:
Fixed Percentage.
2029:
Active User.
Reason:
Improved usage data availability.
This makes finance reporting traceable.
Allocation Versioning
A contract may have:
Draft Allocation v1.
Business Review v2.
Finance Approved v3.
This should be preserved.
Allocation Status
Useful statuses include:
Draft
Under Review
Approved
Effective
This avoids confusion over which model is authoritative.
Allocation Method Governance
Finance should define approved allocation methods.
Examples:
- users;
- headcount;
- consumption;
- fixed.
Business owners should not invent arbitrary methodologies each renewal.
Chargeback vs Showback
Two common internal finance approaches:
Chargeback
Cost is actually charged to department.
Showback
Cost is reported to department but remains centrally funded.
Contract Renewal Tracker can support either by storing the allocation.
Showback Can Still Improve Behavior
Even if cost is centrally paid, showing:
Your department consumes €380K of this contract
can influence:
- license decisions;
- demand reduction.
Visibility itself creates accountability.
Allocation and Business Reviews
A business owner is more likely to challenge unused licenses when the cost affects their own budget.
This is an important behavioral effect.
Example
Marketing owns:
400 licenses.
Allocation:
€200K.
Usage:
Showing:
180 unused seats = approximately €90K of your allocated budget
creates a much stronger incentive to optimize.
Allocation and Demand Reduction
Suppose Marketing reduces:
180 seats.
New allocation:
€110K.
Budget saving:
€90K.
Now the savings attribution is clear.
Shared Savings Allocation
If procurement negotiates:
€200K reduction
across an enterprise contract,
how should that benefit be allocated?
Often:
using the same allocation ratio.
Example
Original:
€1M.
New:
€800K.
Finance share:
30%.
Finance savings:
€60K.
Sales:
50%.
Savings:
€100K.
Marketing:
20%.
Savings:
€40K.
This creates departmental savings attribution.
But Savings Attribution Can Be More Complex
Suppose the reduction came entirely from:
Marketing removing licenses.
Then attributing the saving proportionally to every department may be unfair.
The system should distinguish:
Demand-Driven Savings
from:
Supplier-Wide Negotiation Savings
Savings Attribution Rule
For example:
Quantity Reduction
allocate to the department that reduced usage.
Global Price Discount
allocate proportionally across all consumers.
This is much more defensible.
Example
Marketing removes:
€80K.
Procurement negotiates:
€100K global discount.
Total saving:
€180K.
Marketing gets:
its €80K demand saving
plus:
its share of the €100K price saving.
This preserves causality.
Allocation and Supplier Consolidation
When several contracts consolidate into:
one enterprise agreement,
new cost allocation becomes essential.
Previously:
each department paid its own contract.
After consolidation:
one global invoice.
The tracker can recreate internal ownership.
Consolidation Example
Before:
IT:
€300K.
Sales:
€400K.
Marketing:
€200K.
Combined:
€900K.
New Enterprise Agreement:
€750K.
Allocation can use:
new actual usage.
This helps distribute the €150K saving fairly.
Allocation and Multi-Year Contracts
A multi-year agreement may have:
different yearly values.
Allocations should follow:
each year’s cost profile.
Example
Year 1:
€1M.
Year 2:
€1.05M.
Year 3:
€1.1M.
Department allocations should update accordingly.
This gives finance accurate future budgets.
Allocation and Contracted Escalation
If supplier increases:
3% annually,
department budgets should inherit that escalation.
This can be forecast automatically.
Allocation and Usage Growth
If one department’s usage grows faster:
its allocation may rise even if contract price stays stable.
This helps explain budget changes.
Allocation Forecast
For example:
Sales users:
+15%.
Marketing:
−10%.
Expected future allocation changes accordingly.
This can feed FP&A.
Allocation Confidence
Not every model is equally precise.
Possible confidence levels:
High
Measured consumption.
Medium
Assigned users.
Lower
Fixed percentage estimate.
This helps finance interpret results.
Allocation Data Provenance
Each driver should show its source.
For example:
User Count:
Entra ID.
Headcount:
HR System.
Cloud Consumption:
Cloud Billing API.
This builds trust.
Stale Allocation Data
If user counts are:
six months old,
the allocation may be unreliable.
The system should flag:
Usage Data Stale
before final budgeting.
Allocation Anomaly Detection
AI can help identify unusual changes.
For example:
Sales allocation:
€250K → €600K.
Headcount only increased:
5%.
The system can flag:
Allocation change appears disproportionate to underlying driver.
This prompts review.
Ask AI: Why Did My Department’s Allocation Increase?
The assistant could answer:
Your allocation increased from 22% to 31% because active users rose from 420 to 710 while the total enterprise user base remained relatively stable. The supplier also increased total contract price by 4%.
This is a very practical finance use case.
Ask AI: Which Departments Are Under-Allocated?
The assistant could compare:
usage
against:
current allocation.
For example:
Operations represents 28% of active usage but currently carries only 16% of the contract cost.
This may indicate allocation imbalance.
Ask AI: Which Departments Have Unused Capacity?
For example:
Marketing owns 18% of allocated license cost but represents only 9% of active users. Approximately €70K of its current allocation is associated with inactive licenses.
This directly connects allocation to optimization.
Ask AI: What Allocation Method Is Most Appropriate?
The assistant can recommend based on data availability.
For example:
Active-user allocation appears more representative than headcount because only approximately 35% of employees use the application and usage data is available monthly.
Finance still approves the methodology.
AI Should Not Change Allocation Policy Automatically
The AI can:
- analyze;
- recommend.
Finance governance should control:
- official allocation method.
This maintains consistency.
Ask AI: What Happens If We Reduce 200 Licenses?
The assistant can model:
- total cost change;
- departmental impact.
This supports renewal decision-making.
Scenario Analysis
For example:
Current
€1M.
Renewal As-Is
€1.08M.
Reduce 200 Sales Licenses
€980K.
Sales allocation:
€550K → €450K.
This lets cost owners see the effect of demand decisions.
Allocation Scenario Comparison
A finance team could compare:
Current Method
vs:
User-Based
vs:
Consumption-Based
This helps evaluate fairness and budget impact.
Example
Department A allocation:
Fixed:
40%.
User-based:
32%.
Consumption-based:
28%.
The difference may be material.
Finance can select the most appropriate policy.
Allocation Thresholds
For tiny departments:
the cost may be immaterial.
The system may allocate only above:
minimum threshold.
This can simplify administrative work.
Minimum Allocation
For example:
Department with:
<1% usage.
Could roll into:
Corporate Shared Cost.
This is a finance policy decision.
Rounding Rules
Allocations need to add up exactly to:
100%.
The system should handle:
rounding.
Small detail, but important in financial systems.
Allocation Effective Date
The new allocation may start:
on renewal effective date.
Not:
when budget is approved.
This should be explicit.
Mid-Term Allocation Changes
Sometimes:
departments change during the contract term.
The system can support:
effective-dated allocations.
For example:
January–June:
40%.
July–December:
50%.
This improves accuracy.
Organizational Reorganizations
Departments may merge.
Cost centers change.
The allocation model should not lose historical context.
Use effective dates.
Allocation History
For example:
2028:
Marketing 20%.
2029:
Marketing 12%.
This becomes useful for trend analysis.
Cost Allocation by Region
A global contract could be split:
Europe:
45%.
North America:
35%.
APAC:
20%.
Then each region allocates internally.
This creates multi-level chargeback.
Region + Department Matrix
For complex enterprises:
Europe Sales.
Europe Finance.
US Sales.
US Finance.
The allocation model can support multiple dimensions.
Avoid Excessive Complexity
Just because multidimensional allocation is possible does not mean every customer needs it.
A practical product should support:
simple models first
and:
advanced models for enterprise customers.
Small-Business Allocation
Small companies may only need:
Department.
Amount.
That is sufficient.
Mid-Market Allocation
Add:
- user-based distribution;
- cost centers.
Enterprise Allocation
Add:
- legal entities;
- regions;
- multi-level allocations.
The product scales without overwhelming smaller users.
Allocation and Invoice Reconciliation
Suppose ERP receives one:
€1M invoice.
Contract Renewal Tracker allocation says:
Sales:
€500K.
IT:
€300K.
Marketing:
€200K.
This can feed:
internal journal entries
or:
chargeback processes.
ERP Integration
The platform could export:
Cost Center.
Allocated Amount.
Period.
This reduces manual finance work.
Allocation Export
For example:
| Cost Center | Amount |
|---|---|
| CC-1001 | €300K |
| CC-2040 | €500K |
| CC-3100 | €200K |
This can be consumed by finance systems.
Reconciliation
The system should ensure:
Total Allocations
=
Contract Cost.
If not:
Allocation Reconciliation Error
This prevents incomplete distributions.
Invoice Variance
If actual invoice differs from expected contract cost:
allocations may need recalculation.
For example:
Expected:
€1M.
Actual:
€1.05M.
The extra €50K must be distributed.
Allocation Variance Rule
Possible:
use same percentage distribution
unless:
specific cost can be attributed directly.
This can be automated.
Allocation and Savings Leakage
Suppose new contract saves:
€200K.
But invoice remains:
old price.
Department budgets may appear overrun.
Invoice reconciliation can flag:
Savings Not Realized
This links cost allocation with savings tracking.
Allocation and Budget Forecasting
Future allocation should feed:
department forecasts.
For example:
Sales next year:
€550K.
Current budget:
€480K.
Gap:
€70K.
Finance can intervene before renewal approval.
Budget Owner Alert
Your department’s expected share of the enterprise CRM renewal is €550K, €70K above current budget. Please review usage or request budget adjustment.
This is highly actionable.
Allocation Approval Workflow
For major shared agreements:
Business / Cost Owners review.
↓
Finance validates.
↓
Contract renewal approval.
This ensures cost ownership is agreed.
Allocation Disputes
Departments may challenge the methodology.
The system can record:
Disputed
with:
reason.
This is better than resolving through fragmented email chains.
Allocation Dispute Example
Sales argues:
20% of allocated licenses are centrally managed service accounts.
Finance reviews.
Allocation adjusted.
The audit trail preserves why.
Allocation Audit Trail
Track:
- driver data;
- calculation;
- approver;
- adjustments.
This helps internal audit.
Allocation Policy Versioning
Finance may change allocation rules over time.
For example:
2028:
headcount.
2029:
active users.
Historical reporting should preserve:
which rule applied.
Allocation KPIs
Useful metrics include:
Contracts with Approved Allocation
Allocation Reconciliation Rate
Cost Center Coverage
Allocation Change Variance
Allocation Dispute Rate
These measure finance-process quality.
Allocation Coverage
For example:
Shared contracts with allocation:
94%.
Strategic contracts:
100%.
This gives finance confidence.
Allocation Accuracy
Where actual consumption exists:
compare:
allocated share
to:
actual usage share.
Large differences may signal outdated methodology.
Allocation Drift
For example:
Current allocation:
50%.
Actual usage:
35%.
Drift:
15 percentage points.
This could trigger review.
Allocation Drift Alert
Finance allocation for Marketing differs from measured usage by 18 percentage points.
This helps keep shared-cost models current.
Allocation Review Cycle Time
Measure:
How long does it take to finalize allocations?
If allocation delays renewal approval:
workflow may need improvement.
Cost Allocation Dashboard
Finance might see:
Shared Contracts
Annual Shared Spend
€48M.
Allocation Complete
96%.
Allocation Conflicts
Budget Variance
€1.2M.
This creates a focused operational view.
Department Cost Dashboard
A business leader may see:
Allocated Contract Spend
€3.8M.
Next-Year Forecast
€4.1M.
Renewal-Driven Increase
€300K.
Optimization Opportunities
€180K.
This connects contract decisions directly to budget accountability.
Allocation and Chargeback Behavior
When departments see:
their actual contract cost,
they often make better decisions about:
- licenses;
- service tiers.
Cost transparency can therefore support spend optimization.
Central Procurement vs Local Budgets
Procurement may negotiate centrally.
Business units fund locally.
Contract Renewal Tracker can connect:
central contract
with:
local budget ownership.
This is especially useful for enterprise agreements.
Shared Contract Governance
A global supplier may have:
one business owner
but:
dozens of cost owners.
The system should distinguish:
Contract Owner
from:
Budget Owners
These roles serve different purposes.
Contract Owner
Responsible for:
renewal strategy.
Budget Owner:
responsible for:
allocated cost.
This separation is important.
Shared Decision-Making
If one department wants to exit while others want to remain:
the contract may need:
scope reduction
rather than termination.
The allocation model helps quantify the change.
Example
Sales:
stay.
Finance:
stay.
Marketing:
exit.
Marketing allocation:
€200K.
Result:
Reduce contract scope.
This automatically feeds:
demand reduction.
Shared Contract Renewal Vote Is Not Necessarily Democratic
One department may represent:
80% of usage.
Another:
5%.
The final renewal strategy should follow governance and business criticality, not simply one vote per department.
Cost Allocation Helps Clarify Stakes
If Department A carries:
60% of spend,
its demand outlook may be especially important.
This helps procurement prioritize stakeholder input.
AI Cost Allocation Brief
Before finance review:
Contract
Enterprise CRM.
Total Renewal Value
€1.1M.
Allocation Method
Active users.
Largest Cost Owners
Sales — €550K.
IT — €330K.
Marketing — €220K.
Largest Change
Sales +€150K.
Data Confidence
High.
This makes approval faster.
Ask AI: Why Is Sales Paying More?
The assistant can explain:
Sales’ share of active users increased from 40% to 50%, while total contract cost increased by 10%. Both changes contribute to the €150K increase in Sales allocation.
This is straightforward and useful.
Ask AI: Can We Reduce the Sales Allocation?
The assistant might say:
Approximately 120 Sales licenses have been inactive for more than 90 days. Removing them would reduce expected renewal quantity and could lower Sales’ allocation by roughly €55K, subject to business confirmation.
This connects allocation directly to cost optimization.
Ask AI: Which Shared Contracts Have the Biggest Budget Shifts?
For example:
Five shared contracts create departmental allocation changes above €100K next year. The largest is the enterprise cloud agreement, shifting €380K of cost toward the Digital business unit.
This helps FP&A.
Ask AI: Which Cost Centers Are Over Budget Due to Renewals?
The system combines:
- allocation;
- budgets;
- renewal forecasts.
This creates high-value financial intelligence.
AI Should Explain the Calculation
Users should be able to see:
450 of 1,000 active users = 45% allocation.
No black-box cost distribution.
This builds trust.
Cost Allocation and AI Guardrails
The AI can:
- explain;
- simulate.
It should not silently change:
official finance allocation.
Any changes should go through:
approved workflows.
Cost Allocation ROI
The value may come from:
- fewer manual spreadsheets;
- faster budgeting;
- more accurate chargeback;
- improved demand accountability.
Example Administrative ROI
Suppose finance spends:
15 hours/month
reconciling shared supplier costs.
Automation reduces this to:
3 hours.
Time saved:
144 hours/year.
At €70/hour:
approximately:
€10,080/year
That is before optimization benefits.
Demand Accountability Can Be More Valuable
If cost transparency causes one department to remove:
€80K of unused licenses,
the financial benefit may exceed the administrative saving.
That makes allocation more than an accounting feature.
Contract Renewal Tracker as a Financial Ownership Layer
This is another important evolution.
The platform does not only know:
What does the contract cost?
It can also answer:
Who consumes the value, who owns the budget, and how will the renewal affect each part of the organization?
This greatly improves finance relevance.
From Contract Value to Organizational Cost
The model becomes:
Contract Value
↓
Allocation Driver
↓
Department / Cost Center / Entity
↓
Budget Impact
↓
Renewal Decision
This connects legal commitments with internal financial ownership.
Ready to Make Shared Contract Costs Transparent?
A shared supplier contract should not become a centrally paid black box.
Contract Renewal Tracker is designed to connect enterprise contract costs to the teams, cost centers, and entities that actually consume the service.
Use Contract Renewal Tracker to:
- allocate shared contract costs;
- use fixed-percentage models;
- allocate by users or consumption;
- allocate by headcount;
- support legal-entity splits;
- map allocations to cost centers;
- identify budget owners;
- update allocation at renewal;
- attribute shared savings;
- model allocation scenarios;
- reconcile allocations with invoices;
- forecast departmental budget impact;
- preserve allocation history;
- use AI to explain allocation changes and identify anomalies.
The objective is to move from:
“This contract costs €1 million.”
to:
“We know exactly which departments consume that €1 million, how the allocation was calculated, what each team will pay after renewal, and where demand can still be reduced.”
Start Your Contract Renewal Tracker Subscription →
Final Thoughts
Shared contracts create a simple accounting problem with significant operational consequences.
The organization needs to know:
Who uses the service?
Who owns the cost?
Who benefits from savings?
Without that transparency, renewal decisions can become disconnected from budget accountability.
A mature process links:
Usage
↓
Allocation
↓
Budget Ownership
↓
Renewal Decision
↓
Savings
That gives both finance and business owners a much clearer view of recurring spend.
For Contract Renewal Tracker, cost allocation creates an important bridge between:
enterprise supplier agreements
and:
department-level financial accountability.
And it strengthens the platform’s positioning as more than a contract reminder tool—it becomes part of the organization’s recurring-spend planning and control infrastructure.
Next Article in the Contract Renewal Tracker Series
The next article will go deeper into the forecasting layer. It will cover forecast-versus-actual variance, renewal probability, supplier pricing assumptions, savings conversion, decision uncertainty, forecast bias, horizon accuracy, category-specific accuracy, confidence bands, forecast versioning, root-cause analysis, rolling reforecasts, model calibration, and AI-assisted forecast explanations.
This should further strengthen the finance and CFO buyer proposition by showing how Contract Renewal Tracker can become progressively more reliable at predicting future supplier commitments as historical renewal data accumulates.

