Contract renewal management becomes much easier to justify when the financial outcomes are measurable.
A missed renewal can create unnecessary spend.
An early negotiation can reduce supplier pricing.
A license review can eliminate unused seats.
A termination can remove an entire recurring cost.
A supplier proposal can be negotiated down before it becomes the new baseline.
But organizations often struggle with one deceptively difficult question:
How much did we actually save?
The answer is not always obvious.
If a supplier proposes a 12% increase and procurement reduces it to 4%, that is valuable.
But it is different from reducing current spend.
If the company removes 200 unused licenses, that creates savings.
But it should not also be counted again as generic procurement savings.
If a contract is terminated, future spend is avoided.
But the business may incur migration costs.
A dedicated Contract Renewal Tracker can help make these distinctions explicit and turn renewal savings into a structured, auditable financial record.
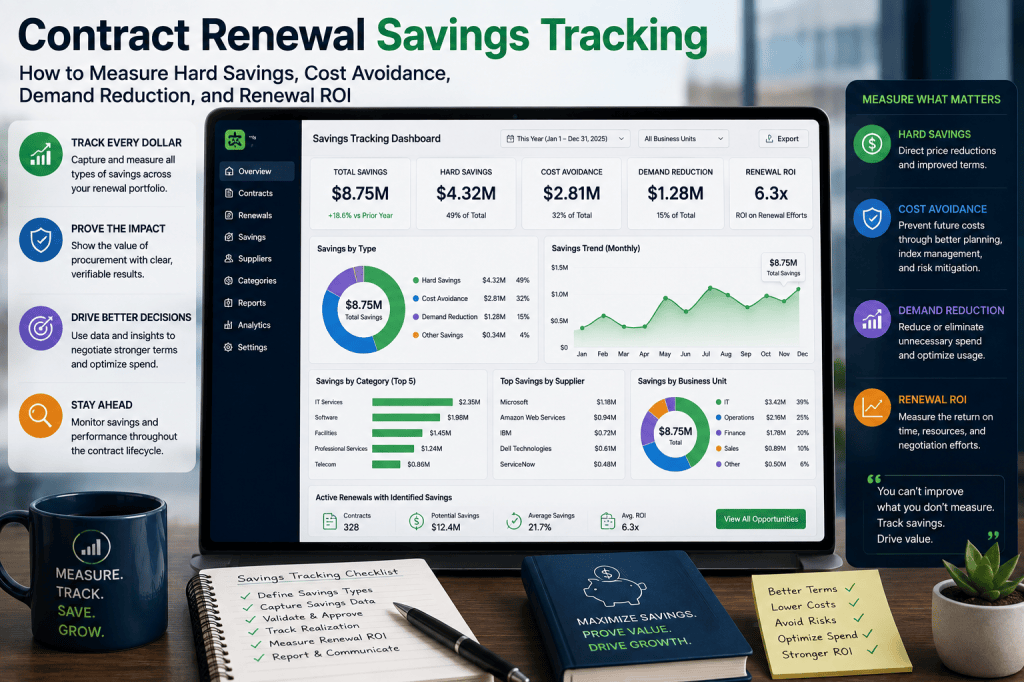
Why Savings Tracking Matters
Procurement teams often report value in several different ways.
Finance may ask:
- Is this a real reduction?
- Is it cost avoidance?
- Is it one-time?
- Is it recurring?
- Does it hit this year’s budget?
- Has it actually been realized?
Without a common methodology, two teams can look at the same renewal and report different numbers.
That creates distrust.
The objective should be:
Use clear definitions, consistent baselines, and finance validation so every reported saving means exactly what management thinks it means.
Want to Prove the Financial Value of Better Renewal Management?
If savings are tracked in disconnected procurement spreadsheets, it becomes difficult to show which contract renewal actually created the value and whether that value was realized.
Contract Renewal Tracker is designed to connect the original contract, supplier proposal, final negotiated terms, quantity changes, termination decisions, and finance validation in one renewal record.
Turn contract renewals into measurable financial outcomes →
Start with the Baseline
Every savings calculation needs a baseline.
The baseline answers:
What would we have spent if we had not changed the commercial outcome?
Possible baselines include:
Current Comparable Spend
Current Unit Price
Supplier Renewal Proposal
Approved Budget
Previous Contract
These should not be treated as interchangeable.
Baseline 1: Current Comparable Spend
This is useful for measuring hard savings.
Suppose:
Current annual spend:
€500K.
Renewed comparable spend:
€460K.
Hard savings:
€40K
This is a genuine reduction in the cost base.
Baseline 2: Supplier Proposal
Useful for measuring cost avoidance.
Suppose:
Current spend:
€500K.
Supplier proposal:
€575K.
Final:
€520K.
Compared with the supplier proposal:
Cost avoidance:
€55K
But compared with current spend:
Spend actually increased:
€20K
Both statements are true.
They must remain separate.
Baseline 3: Budget
Suppose:
Budget:
€540K.
Final renewal:
€520K.
Budget benefit:
€20K
This may matter to finance, but it is not necessarily procurement hard savings.
Baseline 4: Current Unit Economics
Suppose:
1,000 licenses.
€500 each.
Current spend:
€500K.
Renewal:
800 licenses at €480.
Final:
€384K.
The total reduction is:
€116K.
But that reduction has two sources:
Quantity Reduction
and:
Price Reduction
A good system should separate them.
Hard Savings
Hard savings generally represent a reduction in comparable recurring spend.
Example:
Current comparable annual spend:
€500K.
New comparable annual spend:
€470K.
Hard Savings:
€30K annually
This is often the most defensible savings category.
Hard Savings Formula
Simplified:
Current Comparable Cost − New Comparable Cost
For example:
€500K − €470K
=
€30K
The key word is:
comparable.
If scope changed materially, the calculation needs more care.
Scope Matters
Suppose:
Current contract:
€500K for 1,000 users.
New contract:
€400K for 700 users.
You cannot simply claim:
€100K price savings.
Much of the reduction came from buying less.
That should be attributed correctly.
Demand Reduction
Demand reduction is value created by reducing:
- licenses;
- users;
- units;
- locations;
- service scope;
- consumption.
Example:
200 licenses removed.
Unit price:
€500.
Annual demand reduction:
€100K
This is different from negotiating a better price.
Price Savings
Suppose the new quantity is:
800 licenses.
Old unit price:
€500.
New unit price:
€480.
Price improvement:
€20 per license.
800 × €20
=
€16K
Now the renewal outcome can be decomposed:
Demand Reduction:
€100K.
Price Savings:
€16K.
Total Reduction:
€116K.
This is much clearer.
Avoid Double Counting
Do not report:
€116K hard savings
plus:
€100K demand reduction
plus:
€16K price savings
as:
€232K.
The €100K and €16K explain the €116K.
They are not additional value.
The system should support:
Primary Financial Outcome
plus:
Attribution Breakdown
This prevents inflated reporting.
Cost Avoidance
Cost avoidance measures future cost that was prevented.
Example:
Supplier proposal:
€575K.
Final:
€520K.
Cost avoidance:
€55K
The company still pays more than before, but it avoided part of the proposed increase.
Price Increase Avoidance
Current:
€500K.
Supplier proposes:
+15%.
Proposed:
€575K.
Final:
€525K.
Actual increase:
5%.
Avoided increase:
10 percentage points.
Cost avoidance:
€50K
This is commercially valuable even though the cost base did not decline.
Avoided Renewal Spend
Suppose:
Annual contract:
€180K.
Business decides:
Terminate.
Future contract spend:
€0.
Avoided annual spend:
€180K
This is one of the clearest renewal savings outcomes.
But Include Transition Costs
Suppose termination requires:
Migration:
€80K.
Year-one avoided spend:
€180K.
Net year-one benefit:
€100K
Future recurring benefit:
€180K annually.
This gives a more complete picture.
Gross vs Net Savings
A good savings record should distinguish:
Gross Savings
Contract reduction before implementation costs.
One-Time Costs
Migration, implementation, termination.
Net Savings
Gross savings minus relevant costs.
This is especially important for replacement decisions.
Example
Old supplier:
€500K/year.
New supplier:
€360K/year.
Gross annual saving:
€140K.
Migration:
€180K.
Year 1 net:
−€40K
Year 2 onward:
+€140K/year
This does not mean the switch is bad.
It means the payback takes time.
Payback Period
Formula:
One-Time Cost ÷ Annual Recurring Savings
For example:
€180K ÷ €140K
=
approximately:
1.29 years
This helps finance evaluate strategic renewal decisions.
Annualized Savings
Suppose a contract saving begins on July 1.
Annual recurring saving:
€120K.
Current financial-year impact:
6 months.
Recognized annual-period impact:
€60K
The system can show both:
Annualized Savings: €120K
Current-Year Impact: €60K
This improves budget reporting.
Multi-Year Savings
Suppose:
Annual saving:
€50K.
Three-year term.
Contract-term savings:
€150K
But reporting should remain explicit.
Do not display:
€150K
as though it is annual.
Instead show:
Annual Recurring Saving: €50K
Three-Year Contract Impact: €150K
Escalation Savings
Suppose the previous contract includes:
7% annual escalation.
Procurement negotiates:
3%.
Now future savings compound.
Example starting price:
€500K.
7% Path
Year 1:
€500K.
Year 2:
€535K.
Year 3:
€572.45K.
3% Path
Year 1:
€500K.
Year 2:
€515K.
Year 3:
€530.45K.
Three-year difference:
€62K
That is real long-term value.
Renewal Cap Savings
The platform can calculate:
Expected Cost Under Original Escalation
minus:
Expected Cost Under Negotiated Cap
This gives procurement credit for improving future terms.
Supplier Proposal vs Final Outcome
The savings record should preserve the full commercial sequence.
For example:
Current Spend
€500K.
Supplier Proposal
€575K.
Procurement Target
€480K.
Final
€505K.
Now multiple outcomes can be calculated.
Example Breakdown
Spend Increase vs Current
€5K.
Cost Avoidance vs Supplier Proposal
€70K.
Difference vs Target
€25K unfavorable.
Budget
€520K.
Benefit vs Budget
€15K.
This gives management a nuanced picture.
Savings Should Not Be Reduced to One Number
A single “Savings” field often hides too much.
A better record includes:
- hard savings;
- cost avoidance;
- budget variance;
- demand reduction;
- one-time costs;
- annualized effect;
- contract-term effect.
This creates better financial transparency.
Finance Validation
Procurement may create the initial calculation.
Finance should validate official savings.
A workflow could be:
Procurement Calculates
↓
Finance Reviews Baseline
↓
Finance Validates
↓
Official Reporting
This creates governance.
Finance Validation Status
Possible statuses:
Draft
Submitted
Validated
Adjusted
Rejected
Only validated outcomes enter executive savings reporting.
Example
Procurement claims:
€120K.
Finance determines:
€20K relates to reduced business demand already reflected in budget.
Validated procurement savings:
€100K.
The system records both:
Original:
€120K.
Validated:
€100K.
This preserves transparency.
Savings Methodology Field
Each outcome can include:
Calculation Method
For example:
Current Spend vs Final.
Supplier Proposal vs Final.
Unit Price Normalization.
Termination Avoidance.
This helps auditors understand the result.
Evidence
A strong savings record should link to:
- previous contract;
- supplier proposal;
- final agreement;
- quantity calculation;
- finance validation.
Now the financial value is defensible.
Realized vs Contracted Savings
A negotiated saving is not always ultimately realized.
Suppose:
Contract negotiated:
€100K lower.
Then six months later:
additional usage increases spend by €40K.
Actual realized annual benefit may be lower.
The tracker can distinguish:
Contracted Savings
from:
Realized Savings
Savings Lifecycle
A mature savings process could use:
Identified
↓
Validated Opportunity
↓
Negotiated
↓
Contracted
↓
Realized
↓
Finance Confirmed
This makes savings progressively more certain.
Identified Savings
Example:
Unused licenses suggest:
€100K opportunity.
This is not yet a financial result.
It is:
Potential Savings
Validated Opportunity
Business owner confirms:
licenses can be reduced.
Now:
Validated Potential: €100K
Confidence increases.
Negotiated
Supplier agrees to:
€80K reduction.
Now the expected outcome is:
€80K.
Contracted
Signed agreement confirms:
€75K reduction.
Now:
Contracted Savings: €75K
Realized
Actual invoices confirm expected new spend.
Finance verifies:
€75K achieved.
Now:
Realized Savings: €75K
This is the strongest value category.
Confidence-Weighted Savings
Before savings are realized, management may want a forecast.
Possible weighting:
Identified:
25%.
Validated:
50%.
Negotiated:
80%.
Contracted:
100%.
This allows expected-value reporting.
Example
Identified:
€400K × 25%
=
€100K.
Validated:
€300K × 50%
=
€150K.
Negotiated:
€200K × 80%
=
€160K.
Contracted:
€100K.
Weighted forecast:
€510K
This is more realistic than reporting all €1M as guaranteed.
Savings Pipeline
A procurement dashboard might show:
Identified
€2.8M.
Validated
€1.9M.
Negotiating
€1.2M.
Contracted
€850K.
Realized
€620K.
This becomes a commercial pipeline.
Savings Pipeline Coverage
Suppose annual savings target:
€1.5M.
Validated pipeline:
€3M.
Coverage:
2.0×
This suggests reasonable opportunity coverage.
Savings Gap
Target:
€1.5M.
Realized:
€900K.
Expected Additional:
€350K.
Forecast total:
€1.25M.
Remaining gap:
€250K
The system can help procurement identify new renewal opportunities.
Savings Attribution
Organizations may want to understand why savings occurred.
Possible categories include:
- negotiation;
- demand reduction;
- termination;
- supplier consolidation;
- scope reduction;
- price cap improvement;
- sourcing event.
This makes reporting more meaningful.
Example Attribution
Total annual reduction:
€300K.
Drivers:
License reduction:
€120K.
Price negotiation:
€80K.
Supplier consolidation:
€100K.
This explains the result.
Primary Driver
To avoid double counting, each saving can have:
Primary Driver
and optionally:
Supporting Drivers
For example:
Primary:
Supplier consolidation.
Supporting:
Volume discount.
This keeps financial attribution clean.
Savings by Category
For example:
Software:
€1.2M.
Cloud:
€780K.
Telecom:
€320K.
Professional Services:
€610K.
This helps category managers understand impact.
Savings by Business Unit
IT:
€1.4M.
Marketing:
€420K.
Operations:
€680K.
HR:
€210K.
This helps finance understand where cost reduction occurred.
Savings by Supplier
Supplier A:
€380K.
Supplier B:
€240K.
Supplier C:
€190K.
This can highlight procurement success or supplier rationalization.
Savings by Strategy
Renegotiation:
€800K.
Termination:
€700K.
Demand Reduction:
€540K.
Consolidation:
€430K.
This helps leadership see which levers produce the most value.
Hard Savings vs Cost Avoidance Dashboard
An executive dashboard should keep these separate.
For example:
Hard Savings
€1.8M.
Cost Avoidance
€2.9M.
Avoided Spend
€900K.
One-Time Costs
€420K.
Net Recurring Reduction
€2.28M.
This is much more credible than:
Total Savings: €5.6M.
Budget Impact Dashboard
Finance may care most about:
Current-Year Budget Benefit:
€1.1M.
Next-Year Annualized Benefit:
€2.3M.
This supports planning.
Recurring vs One-Time Value
A useful breakdown:
Recurring Savings
€2M annually.
One-Time Credits
€300K.
Implementation Costs
€400K.
This makes the long-term impact clear.
Renewal ROI
The organization can also measure the financial return from Contract Renewal Tracker itself.
Suppose:
Annual subscription:
€20K.
Validated recurring hard savings:
€300K.
Avoided unwanted renewals:
€150K.
Validated cost avoidance:
€450K.
Total tracked financial impact:
€900K.
Value-to-platform-cost ratio:
45×
This can become a powerful product ROI metric.
Be Careful with Attribution
The software should not claim:
Contract Renewal Tracker created €900K.
Procurement professionals, business owners, finance teams, and negotiation efforts created the outcome.
A more credible metric is:
€900K of validated renewal-related financial value tracked through Contract Renewal Tracker.
That wording is stronger because it is defensible.
Platform ROI Formula
A conservative version:
Validated Financial Benefit Attributable to Renewal Actions ÷ Platform Cost
For example:
€300K relevant benefit
÷
€20K
=
15×
Even this conservative calculation can justify the SaaS.
Break-Even Point
Suppose annual platform cost:
€12K.
Annual managed renewal spend:
€10M.
Required improvement for break-even:
€12K ÷ €10M
=
0.12%
The system needs to help improve only a tiny fraction of managed spend to pay for itself.
One Unwanted Renewal Can Pay for the Platform
Example:
Unused software:
€50K/year.
Notice deadline caught.
Contract terminated.
Avoided recurring spend:
€50K.
If the platform costs considerably less than €50K annually, one avoided renewal can justify the subscription.
This is a simple and compelling prospect story.
Productivity ROI
Savings are not limited to supplier spend.
Workflow automation may reduce administrative effort.
Suppose:
1,000 renewals per year.
Manual coordination saving:
20 minutes each.
Time saved:
333 hours.
At:
€60/hour,
productivity value:
approximately:
€20,000
That can be tracked separately from procurement savings.
Keep Productivity Value Separate
Do not combine:
supplier savings
and:
employee productivity
without clearly distinguishing them.
A transparent ROI dashboard should show different benefit categories.
Renewal ROI Dashboard
For example:
Contracted Hard Savings
€420K.
Cost Avoidance
€690K.
Avoided Spend
€280K.
Productivity Value
€45K.
One-Time Implementation Costs
€30K.
Annual Platform Cost
€18K.
Net Tracked Benefit
€1.387M.
This is an executive-ready SaaS value story.
Savings Forecast Accuracy
If the system forecasts:
€1M savings
and actual realized value is:
€700K,
forecast accuracy needs improvement.
This should become measurable.
Forecast Bias
Does procurement consistently overestimate savings?
For example:
Forecast:
€5M.
Realized:
€3.8M.
Repeated variance:
+20–30%.
The organization can adjust weighting assumptions.
Savings Leakage
Savings may be negotiated but not realized because:
- invoices are wrong;
- quantities rise;
- business behavior changes;
- supplier credits are not applied.
This is savings leakage.
A mature system can detect it.
Example Savings Leakage
Contracted annual spend:
€420K.
Actual annualized invoices:
€455K.
Variance:
€35K.
The system can flag:
Contracted savings may not be fully realized.
This connects contracts to finance.
Invoice Validation Integration
If integrated with ERP or AP systems, Contract Renewal Tracker could compare:
Contracted Price
with:
Actual Invoice
This can help verify realized savings.
Supplier Credit Tracking
Suppose negotiation includes:
€40K service credit.
The system should track:
- agreed;
- issued;
- received.
Otherwise, the value can disappear after signature.
Rebate Tracking
Similarly:
Annual rebate:
3%.
Threshold:
€1M spend.
If the threshold is reached, the system can remind finance to validate the rebate.
This extends financial control beyond the renewal date.
Savings Expiration
Some savings are temporary.
For example:
Supplier agrees to:
20% first-year discount.
Then pricing returns to standard rates.
The dashboard should not treat that as permanent recurring savings.
Temporary vs Sustainable Savings
Classify:
Recurring
Temporary
One-Time
This is especially important for CFO reporting.
Example
Year 1 discount:
€100K.
Years 2–3:
No discount.
Report:
One-Time / Temporary Value:
€100K.
Do not annualize it indefinitely.
Savings from Price Caps
A 3% escalation cap may produce value over several future years.
This is neither a one-time discount nor simple current-year savings.
The tracker can classify it as:
Future Cost Avoidance
This keeps reporting precise.
Savings Governance Policy
Organizations should define a written methodology.
For example:
Hard Savings
Comparable reduction against current cost.
Cost Avoidance
Reduction against documented future supplier proposal.
Demand Reduction
Reduction caused by lower volume or scope.
Avoided Spend
Future expenditure removed entirely.
Official Reporting
Finance validation required.
This creates consistency.
Savings Policy Versioning
The methodology may evolve.
Historical savings should remain linked to:
Policy Version
used at the time.
This is useful for audits and year-over-year comparison.
Auditability
A savings calculation should be reproducible.
An auditor should be able to see:
- baseline;
- supplier proposal;
- final contract;
- quantity assumptions;
- calculation;
- finance approval.
This creates trust.
Contract Renewal Tracker as a Savings System of Record
This is an important product evolution.
The system no longer merely stores:
When did the contract renew?
It also stores:
What financial outcome did the renewal create?
That is strategically valuable.
From Deadline to Financial Outcome
The complete lifecycle becomes:
Renewal Identified
↓
Savings Opportunity
↓
Baseline
↓
Negotiation
↓
Final Terms
↓
Savings Calculation
↓
Finance Validation
↓
Realization
This connects renewal operations directly to financial value.
AI Savings Assistant
Procurement could ask:
How much did we save on this renewal?
The AI assistant could respond:
The final annual spend is €470K versus €500K current comparable spend, producing €30K recurring hard savings. The supplier’s opening proposal was €575K, so the negotiation also avoided €105K of proposed annual cost. These values should be reported separately to avoid double counting.
This is an excellent AI use case.
Ask AI: Why Is the Savings Number Lower Than Procurement Expected?
The assistant might answer:
Procurement initially estimated €120K, but finance excluded €25K of reduced demand that was already removed from the approved budget and €10K of one-time credits. Finance-validated recurring savings are therefore €85K.
This creates transparency.
Ask AI: Which Renewals Created the Most Value?
For example:
- Cloud Supplier — €420K.
- SaaS Consolidation — €280K.
- Telecom — €190K.
This gives leadership quick insight.
Ask AI: Where Is Savings Leakage?
The system could identify:
Three contracts have actual invoice run rates above negotiated levels, representing approximately €74K of potential annual savings leakage.
This extends the product beyond negotiation into realized-value protection.
AI Should Respect Finance Methodology
AI should calculate from:
- approved baselines;
- configured definitions;
- validated contract data.
It should not invent its own interpretation of “savings.”
Deterministic financial rules remain authoritative.
Savings Alerts
Useful alerts include:
Finance validation required.
Contracted savings not reflected in invoice run rate.
Rebate due.
Supplier credit not received.
Savings forecast below target.
These keep financial value active after renewal.
Savings Target Alerts
For example:
Annual target:
€2M.
Expected:
€1.6M.
Gap:
€400K.
The system could flag upcoming high-opportunity renewals that may help close the gap.
Savings KPI Set
Useful metrics include:
Hard Savings
Cost Avoidance
Avoided Spend
Demand Reduction
Validated Savings
Realized Savings
Savings Leakage
Pipeline Coverage
Forecast Accuracy
Renewal ROI
This gives procurement and finance a common scorecard.
CFO Dashboard
A CFO may see:
Hard Savings YTD
€1.8M.
Cost Avoidance
€2.7M.
Avoided Spend
€1.1M.
Realized Recurring Benefit
€1.5M.
Savings Leakage
€90K.
Renewal ROI
18×.
This demonstrates financial control.
Procurement Dashboard
Procurement may see:
Opportunities Identified
€4.2M.
Negotiating
€2.8M.
Contracted
€1.9M.
Finance Validated
€1.6M.
Target
€2.0M.
Forecast Gap
€400K.
This becomes a value-delivery dashboard.
Business Owner View
Business owners do not need the entire financial methodology.
They may simply see:
License reduction created €24K annual cost reduction.
This keeps the interface relevant.
Savings by Renewal Outcome
For example:
Renegotiate:
€1.1M.
Reduce:
€620K.
Terminate:
€850K.
Consolidate:
€440K.
This shows which renewal decisions are creating the most value.
The Strongest Commercial Message for Contract Renewal Tracker
At this stage, the product can be positioned far beyond:
Never miss a contract renewal.
A much stronger message is:
Know what is renewing, create enough runway to act, optimize the commercial outcome, and prove the financial value created.
That is much more compelling for procurement and finance buyers.
Ready to Prove the ROI of Better Contract Renewal Management?
Contract renewal savings should not disappear into spreadsheets or become inflated through inconsistent calculations.
Contract Renewal Tracker is designed to connect every financial outcome to the actual renewal decision that created it.
Use Contract Renewal Tracker to:
- establish renewal baselines;
- calculate hard savings;
- measure cost avoidance;
- identify demand reduction;
- track avoided renewals;
- calculate gross and net savings;
- account for migration costs;
- calculate multi-year impact;
- separate recurring and one-time value;
- prevent double counting;
- build savings pipelines;
- validate outcomes with finance;
- measure realized savings;
- detect savings leakage;
- track renewal ROI;
- use AI to explain savings calculations and identify financial opportunities.
The objective is to move from:
“We think we saved money.”
to:
“We know exactly what changed, what financial value was created, how it was calculated, and whether the benefit was actually realized.”
Start Your Contract Renewal Tracker Subscription →
Final Thoughts
The strongest business case for renewal management is not the number of reminders sent.
It is the financial outcome of better decisions.
A mature process can connect:
Contract
↓
Renewal Opportunity
↓
Commercial Action
↓
Financial Outcome
↓
Finance Validation
↓
Realized Value
That creates a complete value chain.
For procurement, it demonstrates commercial impact.
For finance, it provides trusted numbers.
For executives, it makes renewal management measurable.
And for Contract Renewal Tracker itself, it creates perhaps the strongest possible SaaS ROI story:
The platform costs a small fraction of the supplier spend it helps organizations manage—and needs to improve only a tiny percentage of that spend to pay for itself.
Next Article in the Contract Renewal Tracker Series
Article 54 — “Contract Renewal Audit Trails and Compliance: How to Prove Who Changed What, Who Approved It, and What Happened Before Renewal”
The next article will focus on auditability and governance. It will cover immutable event histories, field-change logs, approval evidence, document versions, notice delivery evidence, workflow overrides, permission changes, login/access history, exports, audit queries, retention policies, segregation of duties, internal audit use cases, compliance investigations, and AI-generated audit summaries.
This should be another strong enterprise-focused prospect article because it positions Contract Renewal Tracker as a controlled system of record for renewal decisions—not just a reminder application.

