Managing contracts one at a time is necessary.
But it is not sufficient.
A company may know the renewal date, owner, spend, and risk for every individual agreement and still miss the larger patterns across the portfolio.
For example:
- the same supplier may appear across ten business units;
- three departments may be buying similar software;
- €15 million of spend may renew in the same quarter;
- one supplier may represent a disproportionate share of strategic dependency;
- several contracts may be individually low risk but collectively create a major financial concentration;
- duplicate services may be hidden under different supplier names.
This is where contract renewal portfolio intelligence becomes valuable.
A dedicated Contract Renewal Tracker can analyze the portfolio as a whole and answer a more strategic question:
What patterns, concentrations, dependencies, and commercial opportunities become visible only when we stop looking at contracts one at a time?
That turns renewal management from an operational process into a source of portfolio-level intelligence.
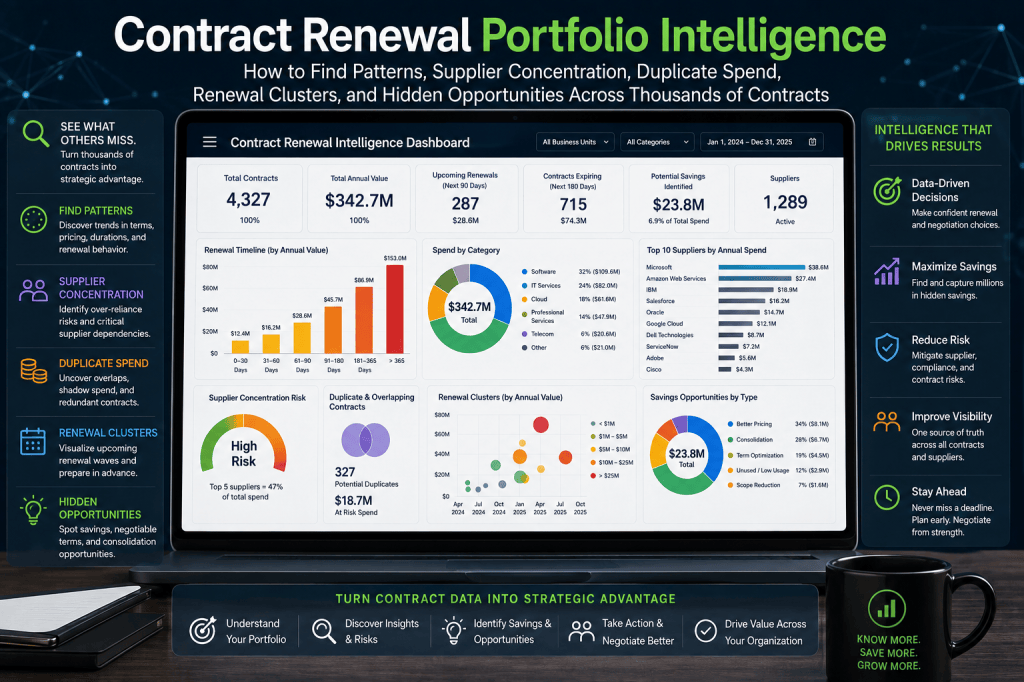
What Is Contract Renewal Portfolio Intelligence?
Portfolio intelligence is the analysis of contract and renewal data across the entire organization to identify patterns that are difficult to see at individual-contract level.
It can examine dimensions such as:
- supplier;
- category;
- department;
- legal entity;
- geography;
- renewal timing;
- contract value;
- risk;
- performance;
- spend;
- ownership.
The result is a deeper view of how the organization’s contractual commitments are structured.
Your Biggest Renewal Opportunity May Not Be Visible in Any One Contract
A procurement manager reviewing individual agreements may see:
€120K.
€180K.
€90K.
€150K.
But if all four agreements belong to the same supplier group and renew in the same quarter, the real commercial opportunity may be:
€540K consolidated negotiation leverage.
Contract Renewal Tracker is designed to surface those portfolio-level relationships automatically.
Turn thousands of contract records into supplier and spend intelligence →
Individual Contract View vs Portfolio View
Consider:
Contract A
Supplier:
ExampleCloud Netherlands.
Annual Value:
€300K.
Contract B
Supplier:
ExampleCloud UK.
Annual Value:
€420K.
Contract C
Supplier:
ExampleCloud Germany.
Annual Value:
€380K.
Each contract looks ordinary.
Portfolio view:
Supplier Group:
ExampleCloud.
Combined Spend:
€1.1M
Renewing within 120 days:
€800K
Now procurement sees a strategic event.
Supplier Concentration
One of the first portfolio metrics should be:
How much contract value is concentrated with a small number of suppliers?
For example:
Top 10 suppliers:
€42M.
Total managed spend:
€100M.
Concentration:
42%
That may be appropriate.
But management should understand it.
Supplier Concentration Is Not Automatically Bad
A strategic supplier may deserve significant spend.
The real question is:
Does concentration create dependency or negotiation risk?
The tracker should combine:
Spend Concentration
with:
Supplier Dependency
and:
Performance
This gives a richer picture.
Example Supplier Concentration Risk
Supplier:
CloudProvider A.
Annual Spend:
€12M.
Share of IT Spend:
28%.
Business Criticality:
Very High.
Alternatives:
Limited.
Performance:
Good.
This is not necessarily a bad supplier relationship.
But it is a major strategic dependency.
Concentration + Renewal Timing
The issue becomes more urgent when a large percentage of that supplier spend renews together.
For example:
Total Supplier Spend:
€12M.
Renewing within six months:
€9M.
Renewal Concentration:
75%
That represents both:
- negotiation leverage;
- commitment risk.
Renewal Concentration Score
A useful metric might be:
Supplier Spend Renewing Within Period ÷ Total Supplier Spend
For example:
€9M ÷ €12M
=
75%.
The higher the concentration, the more strategic the renewal window may be.
Supplier Family Analysis
Supplier normalization is critical.
Without it:
Microsoft Ireland.
Microsoft Corporation.
Microsoft UK.
Microsoft Netherlands.
may appear as four suppliers.
Portfolio intelligence should connect them to:
Microsoft Group
while preserving the legal counterparties.
Parent Supplier View
For example:
Supplier Family
Example Technologies.
Legal Entities
Contracts
Countries
Annual Spend
€14.6M.
Renewing Next 12 Months
€9.2M.
This is highly relevant to global procurement.
Find Fragmented Supplier Spend
A supplier may have multiple independent contracts across departments.
For example:
IT:
€700K.
Marketing:
€220K.
Finance:
€180K.
Operations:
€400K.
Total:
€1.5M
If departments negotiate independently, the organization may be losing leverage.
Fragmentation Indicator
A possible metric:
Number of Independent Contracts per Supplier
For example:
Supplier X:
18 contracts.
Supplier Y:
Supplier X may deserve consolidation review.
Contract Fragmentation Score
This could combine:
- contract count;
- business units;
- renewal-date spread;
- pricing variance.
A high score may indicate procurement opportunity.
Pricing Variance Across Contracts
Suppose different business units buy the same product.
IT
€42/user.
Marketing
€55/user.
Operations
€48/user.
Average:
€48.33.
Price spread:
31%.
This is an obvious internal benchmarking opportunity.
Pricing Variance Alert
The system could flag:
Same supplier/product appears across three contracts with unit pricing varying by 31%.
This can become a sourcing action.
Internal Benchmarking
Before procurement buys expensive external benchmarks, it may already have useful pricing intelligence across its own portfolio.
Contract Renewal Tracker can surface:
- best internal price;
- average;
- worst.
This creates immediate negotiation context.
Duplicate Spend
Duplicate spend occurs when the organization pays for overlapping capabilities more than once.
Examples include:
- multiple project-management systems;
- several e-signature tools;
- duplicate data providers;
- overlapping cybersecurity products.
The suppliers may be different.
The business capability may be the same.
Category-Level Duplicate Detection
For example:
Project Management
Supplier A:
€180K.
Supplier B:
€120K.
Supplier C:
€80K.
Combined:
€380K.
Three tools may be justified.
Or:
they may represent unnecessary fragmentation.
The portfolio view surfaces the question.
Duplicate Does Not Automatically Mean Waste
Different teams may require different solutions.
The system should label:
Potential Overlap
rather than:
Waste
Business validation is required.
AI-Assisted Capability Classification
AI can help classify contracts into business capabilities.
For example:
Asana.
Monday.com.
Smartsheet.
Could all map to:
Work Management / Project Management
This allows the system to identify overlap even when supplier names differ.
Software Category Intelligence
A dashboard might show:
CRM Platforms
3 suppliers.
€1.8M annual spend.
Project Management
5 suppliers.
€620K.
E-Signature
4 suppliers.
€320K.
This gives IT and procurement a rationalization view.
Shadow Procurement
Portfolio analysis may reveal contracts that procurement did not know existed.
For example:
12 departments independently acquired:
AI tools.
Total:
€420K.
Individually:
small.
Collectively:
material.
This can reveal decentralized purchasing patterns.
Long-Tail Supplier Spend
Many organizations have:
hundreds of small suppliers.
The long tail may create:
- administrative burden;
- fragmented buying;
- unnecessary complexity.
Portfolio intelligence can show:
Supplier count:
1,800.
Top 100:
85% of spend.
Remaining 1,700 suppliers:
15%.
This can inform supplier-rationalization strategy.
Supplier Rationalization Opportunities
The goal may not simply be:
reduce supplier count.
Instead:
identify categories where many suppliers provide similar services.
For example:
Marketing agencies:
Combined spend:
€3.2M.
This may justify consolidation.
Renewal Timing Makes Rationalization Actionable
Knowing there are 24 agencies is useful.
Knowing that:
14 of those contracts renew within nine months
is much more actionable.
That creates a natural consolidation window.
Renewal Clustering
Portfolio intelligence should identify periods where many contracts renew together.
For example:
January:
€4M.
February:
€5M.
March:
€18M.
April:
€3M.
March is a clear renewal cluster.
Why Renewal Clusters Matter
Concentrated renewals can create:
- procurement workload;
- legal bottlenecks;
- finance approval pressure.
They can also create:
- supplier consolidation opportunities;
- strategic sourcing leverage.
The same cluster is both:
risk
and:
opportunity.
Renewal Wave Analysis
A dashboard could show:
Q1
€28M.
Q2
€14M.
Q3
€22M.
Q4
€38M.
Q4 requires more preparation.
Cluster by Contract Count
Value is only one dimension.
Suppose:
Q1:
€10M across 400 contracts.
Q2:
€20M across 50 strategic contracts.
Both create different workloads.
The tracker should show:
Count
and:
Value
Cluster by Complexity
A more sophisticated workload model can identify:
Q4:
35 strategic renewals.
70 high-complexity.
220 standard.
This is useful for resource planning.
Department-Level Renewal Clusters
Maybe Marketing has:
70% of its contract spend renewing in June.
That may indicate:
- historical purchasing cycle;
- budget timing.
Procurement can prepare earlier.
Supplier-Level Renewal Clusters
A supplier may have several contracts expiring near each other.
This creates a potential:
consolidated supplier negotiation.
For example:
6 contracts.
€4.1M combined.
Renew between September and November.
The tracker can flag:
Consider coordinated negotiation.
Co-Termination Opportunities
If several contracts are close but not perfectly aligned, procurement may negotiate short extensions to move them to a common future date.
This can create stronger future leverage.
Contract Category Concentration
Portfolio intelligence can also answer:
Where is our contractual spend concentrated by category?
For example:
Cloud:
€18M.
Software:
€22M.
Professional Services:
€15M.
Facilities:
€12M.
Telecom:
€5M.
This provides category exposure.
Category Renewal Exposure
Now add timing:
Software spend:
€22M.
Renewing next 12 months:
€17M.
That makes software a major procurement priority.
Category Risk Exposure
Suppose:
Cybersecurity renewal spend:
€6M.
High/Critical Risk:
€4M.
This is much more significant than simply knowing the category size.
Category Savings Opportunity
For example:
Professional Services:
€8M renewing.
Identified savings:
€900K.
This allows procurement leadership to prioritize resources.
Business Unit Spend Intelligence
A department may have:
Annual Contract Spend:
€12M.
But perhaps:
€4M is in duplicate or overlapping categories.
This creates a business-unit optimization conversation.
Department Contract Density
Useful metric:
Contracts per €1M spend
For example:
Department A:
Department B:
High contract density may indicate excessive fragmentation or lower average contract value.
Contract Fragmentation by Department
Marketing:
220 contracts.
€8M spend.
IT:
140 contracts.
€20M spend.
Marketing has much higher contract fragmentation.
That could justify process simplification.
Owner Concentration
Another hidden risk is contract ownership concentration.
Suppose one procurement manager owns:
180 contracts.
Another:
Or one IT executive is business owner for:
€30M of supplier commitments.
This may create key-person risk.
Ownership Exposure
A dashboard might show:
Top Contract Owner
Annual Value:
€18M.
Contracts:
Inactive Owner Exposure
€2.1M.
This supports workload and succession planning.
Missing Ownership Patterns
Perhaps:
Finance contracts:
99% owner coverage.
Marketing:
82%.
This suggests a departmental governance issue.
Legal Entity Concentration
For international organizations, the portfolio may show:
Netherlands BV:
€42M contract commitments.
Germany GmbH:
€18M.
UK Ltd:
€22M.
This helps group finance understand entity-level exposure.
Currency Concentration
For example:
EUR:
50%.
USD:
35%.
GBP:
10%.
Other:
5%.
This can help finance understand FX exposure associated with future renewals.
Renewal Inflation Exposure
Suppose:
€30M of renewals have proposed supplier increases averaging:
8%.
Potential gross annual cost increase:
€2.4M
Portfolio intelligence can identify where that inflation is concentrated.
Price Increase Heatmap
For example:
| Category | Renewing Spend | Avg Increase |
|---|---|---|
| SaaS | €12M | 11% |
| Cloud | €8M | 8% |
| Telecom | €4M | 2% |
| Services | €6M | 7% |
This guides negotiation strategy.
Supplier Increase Outliers
The system can identify:
Supplier X is proposing 18%, while the category average is 6%.
That creates an internal benchmark.
Spend Anomalies
Portfolio analysis can surface unusual changes.
For example:
Contract value:
€400K.
ERP spend:
€850K.
That is a major anomaly.
Or:
Supplier spend rose 70% year over year without a recorded amendment.
This deserves review.
Spend Growth Without Contract Change
Possible explanation:
- overage;
- uncontracted services;
- additional POs.
The tracker can flag:
Actual spend growth not explained by contract metadata.
This connects portfolio intelligence to control.
Contract Value vs Spend Variance
Across the portfolio:
Contracted Annual Value:
€80M.
Actual Spend:
€92M.
Variance:
+€12M.
This can reveal systemic contract/spend disconnects.
High-Variance Suppliers
The system can rank:
Supplier A:
+35%.
Supplier B:
+22%.
Supplier C:
−10%.
This can inform renewal reviews.
Hidden Auto-Renewal Exposure
Portfolio intelligence can answer:
Where is the most dangerous auto-renewal concentration?
For example:
Auto-Renewing Spend:
€28M.
Undecided:
€6M.
Notice deadline <60 days:
€2.4M.
This becomes an executive metric.
Long-Term Lock-In Exposure
Another portfolio question:
How much spend is locked into contracts longer than three years?
For example:
€48M.
Of that:
€18M with strategic suppliers.
This gives management a flexibility metric.
Lock-In by Category
Cloud:
high.
Software:
medium.
Professional Services:
low.
This can inform contracting strategy.
Supplier Dependency Mapping
Portfolio intelligence should not only measure spend.
Dependency can include:
- switching time;
- operational criticality;
- alternatives.
A supplier with:
€2M spend
may represent more operational dependency than another with:
€10M.
Dependency Heatmap
Plot:
Spend
vs:
Switching Difficulty
High spend + high difficulty:
Strategic Dependency
This becomes a vendor-management priority.
Single-Source Dependency
The platform could identify contracts where:
- no approved alternative supplier exists;
- migration time exceeds 12 months.
These represent higher strategic risk.
Single-Source + Near-Term Renewal
If:
single-source dependency
and:
renewal in 90 days,
management may have limited options.
The platform should surface this early.
Contract Portfolio Segmentation
A large portfolio can be segmented into:
Strategic
High value/criticality.
Leverage
High spend, multiple alternatives.
Bottleneck
Low spend, high dependency.
Routine
Low risk/value.
This resembles procurement portfolio analysis.
It can inform renewal playbooks.
Strategic Contracts
Need:
- early review;
- executive attention.
Leverage Contracts
Good candidates for:
- negotiation;
- competitive sourcing.
Bottleneck Contracts
Need:
- continuity planning;
- risk mitigation.
Routine Contracts
Can use:
- automation;
- fast-track renewal.
This improves resource allocation.
Portfolio Prioritization Score
The system can combine:
Value
Risk
Savings Opportunity
Dependency
Urgency
Then rank the entire portfolio.
Example Priority Score
Contract A:
Contract B:
Contract C:
The score should remain explainable.
For example:
High priority because €1.8M value, 45-day notice deadline, 12% supplier increase, and high replacement feasibility.
This creates an actionable queue.
Opportunity Scoring
Separate from risk.
A contract may be:
low risk
but:
high savings opportunity.
This should still get procurement attention.
Opportunity Dimensions
Possible inputs:
- supplier increase;
- low usage;
- pricing variance;
- duplicate suppliers;
- alternatives;
- consolidation.
This creates a proactive opportunity model.
Portfolio Opportunity Dashboard
For example:
High Savings Opportunities
Potential Value
€4.6M.
Supplier Consolidation Opportunities
Usage Reduction Opportunities
Duplicate Category Reviews
This turns renewals into a commercial pipeline.
Hidden Opportunity: Contract Quantity Differences
Suppose two divisions buy the same supplier product:
Division A:
1,000 licenses.
Division B:
Combined:
1,700.
If supplier pricing tiers improve at:
1,500,
the organization may be eligible for better pricing.
The system can detect this.
Hidden Opportunity: Payment-Term Inconsistency
Supplier A contracts:
Department 1:
30 days.
Department 2:
60 days.
Department 3:
90 days.
The best internal term may become a negotiation benchmark.
Hidden Opportunity: Renewal-Term Inconsistency
Some divisions may have:
12-month auto-renewal.
Others:
36-month.
Portfolio intelligence can identify policy inconsistencies.
Hidden Opportunity: SLA Differences
Two business units may have:
different service levels
with the same supplier.
The organization can seek standardization.
Hidden Opportunity: Price-Cap Differences
One agreement may have:
3% cap.
Another:
8%.
This can become negotiation leverage.
Contract Policy Variance
A dashboard can identify contracts outside standard policy.
For example:
Auto-Renewal Term >12 months:
Price Escalation >5%:
Term >36 months:
This creates governance insight.
Portfolio Compliance Analysis
Instead of reviewing one contract:
management can ask:
How much of the portfolio is outside policy?
For example:
12% of annual value.
This helps prioritize remediation at renewal.
Renewal Is the Natural Policy-Remediation Point
If an old contract has unfavorable:
- escalation;
- auto-renewal;
- term;
the renewal is an opportunity to bring it closer to policy.
Contract Renewal Tracker can flag:
Policy Improvement Opportunity
AI-Assisted Portfolio Pattern Discovery
A conversational AI can make portfolio intelligence accessible.
A procurement leader could ask:
Where are we most fragmented?
The assistant might answer:
Marketing has the highest supplier fragmentation, with 214 contracts across 168 suppliers and €8.1M annual spend. The largest overlaps are in agencies, analytics tools, and design software.
This is much easier than manually analyzing spreadsheets.
Ask AI: Which Suppliers Give Us the Most Leverage?
The assistant could analyze:
- combined spend;
- number of contracts;
- renewal timing.
For example:
Five supplier groups have more than €2M of spend with at least 50% renewing within the next 12 months. ExampleCloud represents the largest combined opportunity at €6.8M.
This creates strategic sourcing insight.
Ask AI: Where Are We Paying Different Prices?
For example:
Supplier X has six contracts for the same product. Unit prices vary from €42 to €61 per user, a 45% spread.
That is immediately actionable.
Ask AI: Which Categories Are Duplicated?
Response:
Project management, e-signature, marketing analytics, and AI productivity tools each have four or more suppliers serving overlapping capabilities.
The system can then create:
Category Rationalization Review
Ask AI: Where Are Renewals Clustering?
38% of annual renewal value falls in Q4, with particularly heavy concentration in software and professional services.
This helps planning.
Ask AI: What Could Become a Problem Next Quarter?
The assistant could combine:
- risk;
- workload;
- concentration.
For example:
Q4 combines the highest renewal value of the year with 26 strategic negotiations and legal-review demand 32% above normal capacity. The largest risk cluster is enterprise software.
This is executive intelligence.
Ask AI: Where Is Supplier Dependency Too High?
The assistant might identify:
Three suppliers combine high business criticality, migration lead times above 12 months, and more than €5M of annual spend.
This supports risk strategy.
Ask AI: Where Can We Simplify?
For example:
The long-tail portfolio contains 620 contracts below €5K, representing only 4% of managed spend but 38% of contract count. Consider a simplified low-value renewal process.
This connects portfolio intelligence to workflow design.
Long-Tail Automation Opportunity
This is an important pattern.
Suppose:
40% of contract count
represents:
5% of spend.
Those contracts may be good candidates for:
- simplified workflows;
- fewer approvals;
- automation.
That can reduce administrative burden.
Portfolio Complexity Index
A future platform could calculate complexity based on:
- contract count;
- supplier count;
- owner count;
- region;
- workflows.
This can help customers understand why renewal management feels difficult.
Contract-to-Supplier Ratio
For example:
4,000 contracts.
1,200 suppliers.
Ratio:
3.3 contracts per supplier.
This can help identify consolidation patterns.
Supplier-to-Category Ratio
If one category has:
50 suppliers,
that may indicate fragmentation.
Another category may legitimately need several suppliers.
Context remains important.
Contract Value Distribution
A portfolio may follow:
Top 5% contracts:
70% of spend.
This has major workflow implications.
The top contracts need:
high-touch management.
The long tail can be automated.
Pareto Analysis
For example:
200 contracts out of 4,000
represent:
80% of value.
Contract Renewal Tracker can automatically identify them.
This creates a practical starting point for implementation.
Strategic Renewal Portfolio
The top-value contracts can receive:
- 365-day planning;
- executive review;
- deeper risk analysis.
The remaining portfolio receives proportionate controls.
Portfolio Workload Intelligence
The system can forecast:
- procurement effort;
- legal workload;
- finance approvals.
But portfolio analysis can also identify structural causes.
For example:
65% of legal reviews are generated by contracts under €25K because workflow policy requires legal review universally.
That suggests policy redesign.
Workflow Optimization from Portfolio Data
Another pattern:
92% of low-value renewals complete without changes.
This suggests:
fast-track automation.
Portfolio intelligence therefore improves the product’s own workflow configuration.
Approval Threshold Analysis
Suppose:
80% of finance approvals under €10K are approved without changes.
Perhaps:
approval threshold should be reconsidered.
The data can inform governance.
Policy Effectiveness
The system can show:
- exception rates;
- rejection rates;
- cycle times.
Then management can ask:
Is the policy helping or creating unnecessary friction?
This is sophisticated process intelligence.
Supplier Performance Patterns
Portfolio-level supplier analytics can reveal:
Suppliers with declining performance before renewal.
For example:
Five strategic suppliers:
performance down >15%.
Combined renewing spend:
€22M.
This becomes a vendor-management priority.
Performance vs Spend
Plot:
Supplier Performance
against:
Annual Spend
High spend + low performance:
priority renegotiation or replacement.
Performance vs Dependency
Low performance + high dependency:
Critical Supplier Risk
These relationships are difficult to see contract by contract.
Contract Risk Concentration
Risk may cluster by:
- supplier;
- region;
- department.
For example:
APAC represents:
22% of spend
but:
48% of High/Critical renewal risk.
This suggests process or data-quality issues.
Data Quality Patterns
Perhaps:
Marketing has 20% missing owner coverage.
Legal entity B has 30% unverified notice periods.
Portfolio intelligence can identify systemic governance problems.
Root Cause Analysis
The assistant could help answer:
Why is renewal risk higher in APAC?
Response:
The primary drivers are lower verified-notice coverage, more inactive owners, and a higher proportion of contracts entering workflow inside 90 days.
This turns metrics into management insight.
Portfolio Forecast Intelligence
Combine patterns with forecasts.
For example:
Q4:
€38M renewing.
Expected supplier increase:
€2.2M.
Savings pipeline:
€1.4M.
Expected net increase:
€800K.
This helps finance plan.
Scenario Analysis at Portfolio Level
Management could ask:
What if we consolidate three project-management suppliers?
The platform can estimate:
- spend involved;
- renewal timing;
- potential reduction.
This does not replace a business case, but it helps identify candidates.
Scenario: Supplier Consolidation
Current:
5 suppliers.
€2M annual spend.
Possible target:
3 suppliers.
Potential savings assumption:
8%.
Estimated annual opportunity:
€160K.
Migration costs still need analysis.
The system should clearly label assumptions.
Portfolio Intelligence Should Not Overclaim
Pattern detection should say:
Potential Opportunity
not:
Guaranteed Saving
The value comes from identifying where humans should investigate.
AI Explanations Should Cite the Data
For example:
Supplier fragmentation is high in Marketing.
The assistant should be able to show:
- supplier count;
- spend;
- overlapping categories.
This keeps intelligence evidence-based.
Executive Portfolio Dashboard
A mature executive view might show:
Active Contracts
8,420
Annual Managed Spend
€620M
Renewing Next 12 Months
€274M
High/Critical Risk
€41M
Top 10 Supplier Concentration
38%
Supplier Consolidation Opportunities
€24M addressable spend
Duplicate Category Reviews
18
Forecast Savings Opportunity
€8.2M
This is far beyond a renewal calendar.
Procurement Portfolio Dashboard
Procurement may see:
Addressable Spend
€110M.
Fragmented Supplier Spend
€18M.
Pricing Variance Opportunities
€6M.
Consolidation Candidates
Supplier Increases >10%
This becomes a sourcing intelligence platform.
CFO Portfolio Dashboard
Finance may care about:
- concentration;
- budget exposure;
- forecast.
For example:
Upcoming Commitment
€274M.
Expected Increase
€6.1M.
Weighted Savings
€4.3M.
Net Forecast Increase
€1.8M.
This connects portfolio intelligence to planning.
Vendor Management Dashboard
Vendor managers may see:
Strategic Suppliers
Performance Below Threshold
High Dependency
Major Renewals Next 180 Days
This supports supplier strategy.
Portfolio Intelligence for Small Businesses
The same concept can work on a smaller scale.
A company with:
80 contracts
might discover:
- four overlapping SaaS products;
- two suppliers with multiple agreements;
- 40% of spend renewing in Q4.
Portfolio intelligence does not require thousands of contracts to be useful.
Portfolio Intelligence for Mid-Market
This may be particularly valuable.
A company with:
500–2,000 contracts
often has enough complexity to hide meaningful patterns but may not yet have sophisticated spend analytics.
Contract Renewal Tracker can fill that gap.
Enterprise Portfolio Intelligence
At enterprise scale, the platform can support:
- regions;
- legal entities;
- currencies;
- supplier families.
This creates a global renewal intelligence layer.
Private Equity Portfolio Intelligence
PE firms could apply similar logic across portfolio companies.
For example:
Supplier X appears across:
7 companies.
Combined spend:
€12M.
This creates cross-company sourcing opportunity.
Strong tenant and confidentiality controls would be required.
M&A Portfolio Intelligence
After an acquisition, the system can compare:
Legacy A.
Legacy B.
Then identify:
- duplicate suppliers;
- software overlap;
- pricing differences.
This makes portfolio intelligence highly relevant to post-merger integration.
Portfolio Intelligence + AI Assistant
The combination is powerful.
Structured analytics identifies:
patterns.
AI explains:
what they mean.
Then workflow automation turns:
insight
into:
action.
For example:
Pattern
Five duplicate SaaS tools.
↓
AI
Summarizes overlap.
↓
Workflow
Creates category review.
This closes the intelligence loop.
From Pattern Detection to Action
A mature platform should not stop at:
We found an opportunity.
It should allow users to create:
- supplier consolidation project;
- sourcing review;
- data remediation;
- negotiation workflow.
This turns analytics into operational value.
Opportunity-to-Workflow Example
System detects:
4 contracts.
Same supplier.
Combined spend:
€2.6M.
All renew within 180 days.
User selects:
Create Consolidated Negotiation
The platform creates:
- one procurement project;
- linked contracts;
- target timeline.
This is a strong SaaS experience.
Portfolio Intelligence KPIs
Useful metrics include:
Supplier Concentration
Renewal Concentration
Contract Fragmentation
Duplicate Category Spend
Pricing Variance
Long-Tail Supplier Count
High-Dependency Spend
Policy Variance
Savings Opportunity
These make portfolio structure measurable.
Supplier Concentration Trend
For example:
2027:
46%.
2028:
42%.
2029:
38%.
This may show successful diversification.
Fragmentation Trend
Supplier count:
1,400 → 1,180.
Contracts:
4,200 → 3,800.
If spend remains stable, the organization may be simplifying procurement.
Duplicate Spend Trend
Overlap:
€4M → €2.7M.
This can demonstrate software rationalization progress.
Opportunity Conversion
Identified portfolio opportunities:
€5M.
Validated:
€3M.
Realized:
€1.2M.
This connects intelligence to financial results.
AI-Detected Opportunities KPI
A future dashboard could show:
AI identified:
Human validated:
Actions created:
This helps assess whether AI recommendations are useful.
Avoid Generating Hundreds of Weak Opportunities
The system should prioritize:
fewer
high-confidence
high-value patterns.
Otherwise users will ignore the recommendations.
Quality matters more than quantity.
Portfolio Intelligence as a Competitive Differentiator
Basic renewal tools answer:
Which contracts renew soon?
Contract Renewal Tracker can evolve to answer:
What does the structure of our entire contract portfolio tell us about supplier leverage, risk, duplication, and future opportunities?
That is a significantly stronger value proposition.
From Contracts to Portfolio Intelligence
The product evolution becomes:
Contract Record
↓
Renewal Workflow
↓
Risk
↓
Financial Outcomes
↓
Supplier Intelligence
↓
Portfolio Patterns
↓
Strategic Action
At that point, Contract Renewal Tracker is becoming much more than a reminder tool.
Ready to See What Your Contract Portfolio Is Hiding?
The most valuable renewal opportunity may not appear inside one contract.
It may exist across:
- several suppliers;
- multiple departments;
- different regions;
- dozens of renewal dates.
Contract Renewal Tracker is designed to connect those records and surface the patterns humans struggle to see manually.
Use Contract Renewal Tracker to:
- measure supplier concentration;
- aggregate supplier families;
- find fragmented supplier spend;
- identify pricing variance;
- detect overlapping software and services;
- analyze long-tail supplier complexity;
- find renewal clusters;
- identify co-termination opportunities;
- measure category exposure;
- surface supplier dependency;
- identify policy outliers;
- detect spend anomalies;
- rank savings opportunities;
- analyze portfolio risk;
- use AI to explain hidden patterns and recommend where teams should investigate next.
The objective is to move from:
“We have thousands of contract records.”
to:
“We understand what those contracts collectively tell us about our suppliers, spend, risk, and commercial opportunities.”
Start Your Contract Renewal Tracker Subscription →
Final Thoughts
A contract portfolio is more than a collection of individual agreements.
Together, those contracts reveal:
how purchasing is fragmented,
where supplier leverage exists,
where risk is concentrated,
where costs overlap,
and:
when strategic windows for change are approaching.
The full intelligence loop becomes:
Contracts
↓
Normalize
↓
Aggregate
↓
Detect Patterns
↓
Prioritize Opportunities
↓
Create Action
This creates another major evolution in the Contract Renewal Tracker proposition.
The system begins by preventing missed renewals.
It then helps improve individual renewal decisions.
Finally, it can begin to help management understand the structure and economics of the entire contract portfolio.
That is a far more strategic SaaS category—and potentially a strong reason for procurement, CFO, and enterprise customers to keep using the platform long after their basic renewal-reminder problem has been solved.
Next Article in the Contract Renewal Tracker Series
Article 59 — “Contract Renewal Benchmarking: How to Compare Prices, Renewal Terms, Supplier Performance, Cycle Times, and Savings Across Your Contract Portfolio”
The next article will build directly on portfolio intelligence and focus on internal benchmarking. It will cover unit-price comparisons, supplier pricing variance, contract-term benchmarks, notice periods, escalation caps, payment terms, renewal cycle times, supplier negotiation behavior, business-unit comparisons, savings benchmarks, peer-group analysis inside the organization, normalization, confidentiality, and AI-assisted benchmark interpretation.
This should be another strong prospect-conversion article because it demonstrates how Contract Renewal Tracker can transform historical renewal data into negotiation intelligence—allowing every new renewal to benefit from what the organization learned from previous ones.

