Contract renewal management improves when organizations stop measuring activity and start measuring outcomes.
It is easy to track:
- number of reminders sent;
- number of tasks created;
- number of contracts in the system.
Those metrics may be useful operationally, but they do not tell management whether the renewal process is actually working.
A stronger KPI framework should answer questions such as:
Are we making decisions early enough?
Are we preventing unwanted renewals?
Are we reducing recurring spend?
Are suppliers becoming more expensive?
Are forecasts becoming more accurate?
Are termination and replacement decisions actually being executed successfully?
A dedicated Contract Renewal Tracker can calculate these metrics directly from contract, workflow, financial, supplier, and audit data.
The result is a measurable renewal operating model.
Why Contract Renewal KPIs Matter
Without defined KPIs, renewal management can become anecdotal.
Procurement says:
Negotiations are improving.
Finance says:
Forecasting still feels uncertain.
Legal says:
We are getting too many last-minute notices.
Contract operations says:
Owners are responding more quickly.
All may be correct.
But without measurement, it is difficult to know:
- how much;
- where;
- whether performance is improving.
KPIs make renewal maturity visible.
Can You Measure Whether Your Renewal Process Is Actually Improving?
Knowing that contracts renew on time is only part of the picture.
Contract Renewal Tracker is designed to measure the financial, operational, legal, and supplier outcomes behind each renewal so teams can see whether their process is becoming faster, safer, and more commercially effective.
Turn renewal management into a measurable operating discipline →
KPI 1: Renewal Exposure
Renewal Exposure measures the value of contracts entering renewal within a defined period.
For example:
Next 90 days:
€12.4M.
Next 180 days:
€29.8M.
Next 12 months:
€84M.
This tells leadership how much contractual spend is approaching a decision point.
Why it matters
It provides context for:
- workload;
- budgeting;
- negotiation planning.
KPI 2: High-Risk Renewal Exposure
Do not measure only:
number of High-risk contracts.
Measure:
financial value at risk.
For example:
High/Critical renewal value:
€4.8M.
This is much more meaningful than:
38 contracts.
Formula
Sum of annual or committed value for High/Critical renewals
depending on the reporting method.
KPI 3: Decision Coverage
Decision Coverage measures how much upcoming renewal value has a confirmed strategy.
Possible decisions include:
- Renew;
- Renegotiate;
- Reduce;
- Replace;
- Extend;
- Terminate.
Formula
Renewal Value with Confirmed Decision ÷ Total Renewal Value
Example:
€10M decided
÷
€12M upcoming
=
83.3%
Why it matters
Low decision coverage creates:
- negotiation risk;
- budget uncertainty.
KPI 4: Undecided Renewal Spend
This is the inverse perspective.
Upcoming renewal value:
€12M.
No confirmed decision:
€2M.
Result:
€2M Undecided Spend
For executives, this is often easier to understand than a percentage.
KPI 5: Late Decision Rate
A renewal strategy should be decided before an internal decision deadline.
Formula
Decisions Made After Internal Deadline ÷ Total Decisions
Example:
18 late decisions
out of:
Late Decision Rate:
9%
Why it matters
Late decisions compress time available for:
- procurement;
- legal;
- approvals.
KPI 6: Passive Renewal Rate
A contract should not renew merely because nobody acted.
Formula
Material Renewals Without Explicit Decision ÷ Total Material Renewals
Target for controlled environments:
0%
This is one of the strongest governance KPIs.
KPI 7: Auto-Renewal Exposure
Measure total annual spend associated with contracts containing automatic renewal provisions.
For example:
Auto-renewing portfolio:
€28M.
That becomes more useful when combined with:
- notice deadline;
- decision status.
KPI 8: At-Risk Auto-Renewal Spend
A stronger metric:
Auto-renewing value approaching notice deadline without completed decision.
For example:
€1.4M.
This is the portion of auto-renewal exposure that may create unwanted commitment.
KPI 9: Missed Renewal Deadline Rate
Formula
Renewals Where Required Action Missed ÷ Total Renewals
Example:
2 / 1,000
=
0.2%
For material contracts, many organizations should target:
0%
KPI 10: Financial Impact of Missed Renewals
A missed deadline count alone does not show severity.
For example:
2 missed renewals.
Associated avoidable spend:
€180K.
This gives management a financial consequence.
KPI 11: Notice Compliance Rate
For non-renewals and terminations:
Formula
Notices Completed Correctly Before Deadline ÷ Notices Required
Example:
98 / 100
=
98%
For high-value contracts, the target should generally be:
100%.
KPI 12: Notice Evidence Coverage
A termination may have been executed, but is the evidence stored?
Formula
Completed Notices with Required Delivery Evidence ÷ Completed Notices
For example:
96%.
This is particularly useful for legal and compliance teams.
KPI 13: Business Review Completion Rate
Before negotiation, material renewals should undergo business review.
Formula
Completed Business Reviews ÷ Reviews Due
For example:
185 / 200
=
92.5%
Why it matters
Without business review:
procurement may negotiate unnecessary demand.
KPI 14: Demand Reduction Value
This measures recurring spend reduced through:
- license reduction;
- scope reduction;
- site closures;
- capacity optimization.
For example:
Annual demand reduction:
€1.4M
This should remain separate from price negotiation savings.
KPI 15: Hard Savings
Hard savings represent comparable reductions in recurring cost.
Example:
Previous comparable spend:
€500K.
New:
€460K.
Hard savings:
€40K.
Portfolio:
€2.1M validated hard savings
This is a core procurement KPI.
KPI 16: Cost Avoidance
Cost avoidance measures prevented future increases.
Example:
Supplier proposal:
€600K.
Final:
€530K.
Cost avoidance:
€70K.
This is valuable but should remain separate from hard savings.
KPI 17: Realized Savings Rate
Negotiated value does not always become realized value.
Formula
Realized Savings ÷ Contracted Savings
Example:
€800K realized
÷
€1M contracted
=
80%
This can expose:
- billing leakage;
- usage growth.
KPI 18: Savings Pipeline Conversion
A useful funnel is:
Identified → Validated → Negotiated → Contracted → Realized
For example:
Identified:
€4M.
Validated:
€2.5M.
Realized:
€1.4M.
This tells procurement how effectively opportunities turn into actual value.
KPI 19: Supplier Proposed Inflation
Measure average supplier increase across renewal proposals.
For example:
Current spend:
€20M.
Proposals:
€21.8M.
Proposed inflation:
9%
This is an important financial pressure indicator.
KPI 20: Final Renewal Inflation
Compare the final renewed cost against previous comparable spend.
For example:
Final portfolio increase:
4.2%.
Supplier proposed:
9%.
The difference demonstrates negotiation and optimization impact.
KPI 21: Negotiation Cycle Time
Measure:
First Supplier Proposal → Final Commercial Agreement
For example:
Average:
47 days.
Strategic contracts:
82 days.
This helps determine when negotiation workflows should begin.
KPI 22: Approval Cycle Time
Measure:
Approval Request → Final Approval
For example:
Finance:
3.2 days.
Legal:
6.4 days.
Executive:
4.1 days.
This helps identify bottlenecks.
Approval SLA Compliance
A complementary KPI:
Percentage of approvals completed within agreed SLA.
For example:
Finance:
96%.
Legal:
84%.
This can help operations focus improvement efforts.
KPI 23: Renewal Cycle Time
Measure the full process:
Renewal Workflow Start → Completion
For example:
Standard:
42 days.
Strategic:
165 days.
This helps benchmark operational performance.
KPI 24: Forecast Accuracy
Finance needs to know how reliable future renewal-spend forecasts are.
For example:
90-Day Accuracy:
96%.
180-Day:
91%.
365-Day:
84%.
This tells finance when forecasts become dependable.
Forecast Bias
Accuracy alone is not enough.
If forecasts consistently underestimate spend:
Bias:
+2.5%.
This means actual cost tends to be higher than forecast.
The system should measure both.
KPI 25: Renewal ROI
Finally, Contract Renewal Tracker itself should demonstrate business value.
A conservative model can compare:
Validated Renewal-Related Financial Benefit
against:
Platform Cost
For example:
Hard savings:
€300K.
Avoided unwanted spend:
€150K.
Annual platform cost:
€20K.
Value-to-cost ratio:
22.5×
The software should not claim to have created all of that value independently.
A defensible wording is:
€450K of validated renewal-related financial value managed through Contract Renewal Tracker.
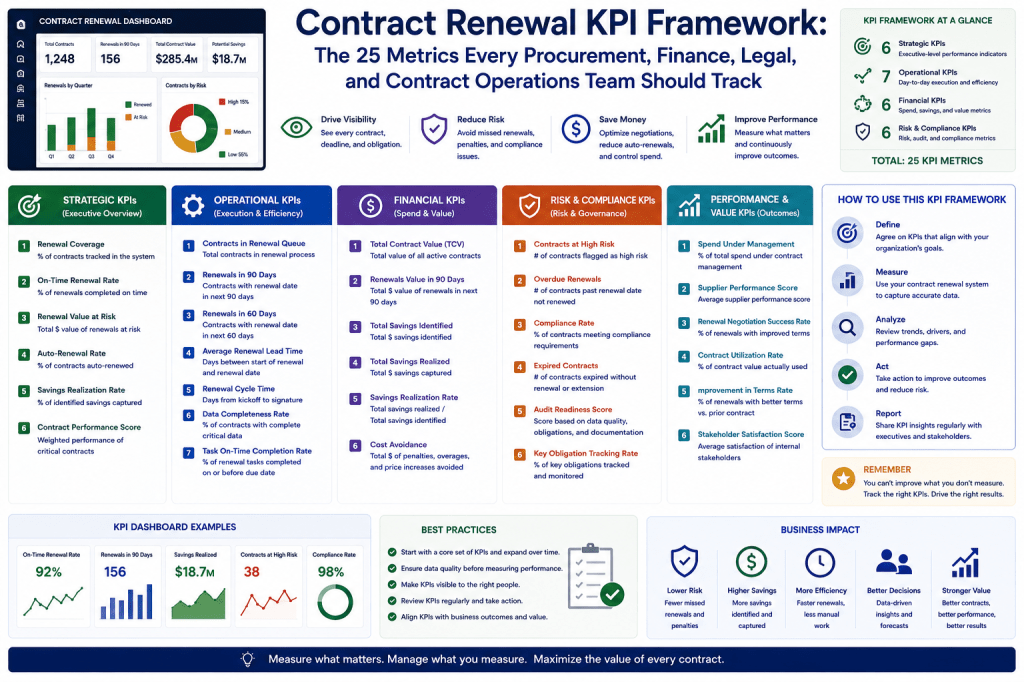
The 25-KPI Framework at a Glance
A practical KPI set can be grouped into five categories.
Renewal Control
- Renewal Exposure
- High-Risk Renewal Exposure
- Decision Coverage
- Undecided Spend
- Late Decision Rate
- Passive Renewal Rate
- Auto-Renewal Exposure
- At-Risk Auto-Renewal Spend
- Missed Deadline Rate
- Financial Impact of Missed Renewals
Legal and Compliance
- Notice Compliance Rate
- Notice Evidence Coverage
Spend and Procurement
- Business Review Completion
- Demand Reduction Value
- Hard Savings
- Cost Avoidance
- Realized Savings Rate
- Savings Pipeline Conversion
- Supplier Proposed Inflation
- Final Renewal Inflation
Operational Performance
- Negotiation Cycle Time
- Approval Cycle Time
- Renewal Cycle Time
Finance and ROI
- Forecast Accuracy
- Renewal ROI
This gives management a balanced view.
Not Every User Needs All 25 KPIs
The same KPI framework should be distributed by role.
A CFO does not need every operational workflow metric.
A contract administrator does not need every portfolio-finance metric.
Role-specific scorecards make the data more useful.
CFO KPI Scorecard
A CFO might focus on:
- renewal exposure;
- undecided spend;
- supplier inflation;
- hard savings;
- budget variance;
- forecast accuracy;
- renewal ROI.
This is a financial view.
Procurement KPI Scorecard
Procurement may focus on:
- negotiation cycle time;
- supplier inflation;
- hard savings;
- cost avoidance;
- savings conversion;
- demand reduction;
- consolidation opportunities.
This is a commercial-performance view.
Legal KPI Scorecard
Legal may focus on:
- notice compliance;
- evidence coverage;
- late decisions;
- policy exceptions;
- legal review cycle time.
This is a control and execution view.
Contract Operations KPI Scorecard
Contract operations may focus on:
- decision coverage;
- overdue workflows;
- cycle time;
- missed deadlines;
- data quality;
- business review completion.
This is the operational-health view.
Executive KPI Scorecard
Executives generally need only:
- upcoming renewal exposure;
- Critical exposure;
- undecided spend;
- budget variance;
- savings;
- material missed deadlines;
- executive decisions required.
Keep it concise.
KPI Targets Should Be Configurable
Not every company should use identical targets.
For example:
Missed Deadline Rate
Target:
0%.
Business Review Completion
Target:
95%.
Forecast Accuracy
Target:
90% at 90 days.
Approval SLA
Target:
95%.
These should reflect organizational maturity and contract materiality.
Tier-Specific KPI Targets
Strategic contracts may require:
100% notice verification.
Low-value contracts may tolerate more automation and less human review.
The system should support proportional governance.
KPI Trends Matter More Than Single Numbers
Suppose:
Late Decision Rate:
8%.
Is that good or bad?
If last year:
18%,
the process is clearly improving.
Trend is essential.
Example Trend
Late decisions:
18% → 12% → 8%.
Missed deadlines:
1.5% → 0.6% → 0.1%.
Forecast accuracy:
82% → 88% → 94%.
This shows increasing renewal maturity.
Leading vs Lagging KPIs
Some metrics tell you:
what already happened.
Others warn what may happen.
This distinction is useful.
Leading Indicators
Examples:
- undecided spend;
- business review completion;
- at-risk auto-renewal value;
- overdue approvals.
These help prevent future problems.
Lagging Indicators
Examples:
- missed deadlines;
- realized savings;
- forecast accuracy.
These measure outcomes.
A strong dashboard includes both.
Why Leading Indicators Matter Most Operationally
By the time:
Missed Renewal Spend
appears,
the damage may already be done.
Undecided Spend 90 days earlier could have warned management.
Contract Renewal Tracker should emphasize preventative KPIs.
Financial KPIs Need Clear Definitions
For example:
“Total Savings”
can easily become misleading.
Use defined categories:
Hard Savings
Cost Avoidance
Avoided Spend
This improves finance trust.
Operational KPIs Need Comparable Definitions
For example:
Renewal Cycle Time should always have the same:
- start;
- end.
Otherwise comparisons become meaningless.
KPI Governance
A mature organization should maintain:
KPI Name
Definition
Formula
Data Source
Owner
This creates consistency.
Example KPI Definition
Decision Coverage
Definition:
Percentage of upcoming renewal value with approved renewal strategy.
Numerator:
contracts with Confirmed Decision.
Denominator:
all contracts within selected horizon.
Owner:
Contract Operations.
This avoids ambiguity.
KPI Data Provenance
Every KPI should ultimately trace back to:
- contract records;
- workflows;
- finance data.
If executives click:
€4.8M High-Risk Exposure
they should be able to see:
which contracts contribute.
This builds confidence.
KPI Data Quality
A KPI based on unreliable contract data should expose that limitation.
For example:
Renewal exposure is €82M, but 7% of contract value remains unverified.
This is more transparent than pretending total precision.
KPI Confidence
For forecast-oriented measures, the system can show:
High / Medium / Low confidence.
For deterministic metrics:
such as missed deadlines,
confidence should be much stronger if underlying data is verified.
KPI Materiality
A metric should not treat every contract equally.
For example:
Missed Deadline Rate:
1%.
But:
all misses are low-value contracts.
That is different from:
one €20M strategic miss.
Therefore, show both:
count
and:
financial impact.
KPI Segmentation
Almost every KPI should be filterable by:
- department;
- supplier;
- category;
- region;
- contract tier.
This helps users locate the underlying cause.
Example
Late Decision Rate:
Portfolio:
8%.
Marketing:
18%.
IT:
4%.
Now operations knows where improvement is required.
KPI Benchmarking
Historical internal benchmarking can show:
Strategic renewal cycle time improved from 190 days to 154 days.
This helps management see progress.
Supplier-Level KPI Analysis
For example:
Supplier A:
average negotiation time 70 days.
Supplier B:
28 days.
This can influence future planning.
Category-Level KPI Analysis
SaaS hard savings:
6%.
Telecom:
9%.
Cloud:
2%.
This helps procurement understand where different strategies work.
KPI Relationships
Metrics should not be interpreted in isolation.
For example:
Lower renewal cycle time
sounds good.
But if savings also fall:
perhaps the process became too fast.
This is why balanced scorecards matter.
Speed vs Savings
Suppose:
Cycle time:
80 → 40 days.
Savings:
6% → 3%.
Maybe procurement is rushing.
The system can help identify these tradeoffs.
Speed vs Risk
Shorter cycle time:
good.
But if:
late decisions rise,
the process may merely be starting later.
Again, context matters.
KPI Causality
Contract Renewal Tracker can help explain:
Late business reviews correlate with lower savings and higher renewal risk.
This is more useful than isolated numbers.
AI-Assisted KPI Interpretation
A user could ask:
Why did renewal performance worsen this quarter?
The assistant might answer:
Late Decision Rate increased from 6% to 11%, primarily in Marketing and Professional Services. Those same renewals account for most of the increase in High-risk exposure.
This turns metrics into insight.
Ask AI: Which KPI Should I Worry About?
For example:
At-risk auto-renewal spend is currently the most urgent metric. It increased from €400K to €1.1M because six contracts entered their final notice windows without confirmed decisions.
This is highly actionable.
Ask AI: Why Are Savings Down?
The assistant might say:
Validated hard savings are 18% below last year’s run rate. The main reason is a lower number of demand-reduction decisions rather than weaker price negotiation outcomes.
This gives procurement useful direction.
Ask AI: Why Is Forecast Accuracy Improving?
For example:
90-day accuracy improved from 91% to 96% because high-value business decisions are now being completed earlier and supplier proposals are available sooner.
This connects KPI improvement to process change.
AI KPI Commentary
The assistant can create a monthly management summary:
Renewal performance improved this month. Critical exposure declined 22%, decision coverage rose to 91%, and no material notice deadlines were missed. The primary concern remains supplier inflation, currently 1.4 percentage points above budget assumptions.
This is executive-ready.
AI Should Never Invent KPI Explanations
Any causal explanation should be grounded in:
- actual data.
If the reason cannot be established:
say:
The data shows correlation, but the cause is not yet clear.
This maintains credibility.
KPI Alerts
Some KPIs should trigger notifications when thresholds are breached.
Example:
Decision Coverage <80%
inside 60 days.
This can trigger management attention.
Example Rules
IF decision_coverage_60_days < 80%THEN alert_contract_operations
Another:
IF missed_deadline_count_material > 0THEN alert_executive_owner
This makes KPIs operational.
Supplier Inflation Alert
IF expected_supplier_inflation > budget_assumption + 2%THEN notify_finance_and_procurement
This connects KPI monitoring to action.
KPI Thresholds Should Avoid Alert Fatigue
Do not alert users every time a metric changes slightly.
Use:
- materiality;
- persistence;
- severity.
This keeps management attention focused.
KPI Dashboard Design
A strong dashboard should answer:
What is the current state?
Is it improving?
What is outside threshold?
What needs action?
These four questions are more important than visual complexity.
KPI Cards
For example:
Decision Coverage
91%.
↑ 4%.
Target:
95%.
This immediately shows:
- current;
- trend;
- target.
KPI Drill-Down
Click:
Decision Coverage 91%.
See:
undecided contracts.
This connects measurement to operational work.
KPI by Role
Dashboard filters can automatically reflect:
user scope.
For example:
Department head sees:
their contracts.
CFO sees:
enterprise.
This keeps the same KPI framework useful across the organization.
KPI History
Store monthly snapshots.
This allows:
- trend charts;
- year-over-year comparisons.
Historical KPI data becomes another source of organizational learning.
Quarterly KPI Review
A mature organization could review:
- Which KPIs missed target?
- Why?
- What process changes are required?
This turns the tracker into a continuous-improvement platform.
Example
KPI:
Business Review Completion.
Target:
95%.
Actual:
82%.
Root Cause:
owner reassignment delays.
Action:
integrate HR ownership updates.
Now the KPI drives product/process improvement.
KPI Maturity Model
A useful progression:
Level 1 — Visibility
Renewal counts and dates.
Level 2 — Control
Decision coverage and deadlines.
Level 3 — Commercial
Savings and inflation.
Level 4 — Predictive
Forecast accuracy and risk.
Level 5 — Optimization
Portfolio intelligence and ROI.
This shows how customers can grow with the platform.
Level 1: Basic Tracking
Metrics:
- renewals due;
- overdue.
Useful but limited.
Level 2: Managed Renewals
Add:
- decisions;
- notice compliance;
- cycle time.
The process becomes controlled.
Level 3: Commercial Management
Add:
- hard savings;
- cost avoidance;
- supplier inflation.
Now procurement value becomes visible.
Level 4: Predictive Management
Add:
- forecast accuracy;
- risk exposure.
Management can act earlier.
Level 5: Strategic Optimization
Add:
- supplier concentration;
- portfolio optimization;
- renewal ROI.
The platform becomes strategic.
KPI Selection for an MVP
Contract Renewal Tracker does not need all 25 KPIs on day one.
A strong MVP might start with:
- renewal exposure;
- decision coverage;
- auto-renewal risk;
- missed deadline rate;
- hard savings;
- cycle time.
This provides immediate value.
Add Advanced Metrics Later
Then add:
- supplier inflation;
- forecast accuracy;
- savings conversion;
- ROI.
This keeps product development focused.
KPI Data Model
A robust system may store:
raw events
and:
calculate KPIs from them.
This is preferable to manually entering KPI results.
The metric should be derived from operational truth.
Example
Do not ask a user:
What is your approval cycle time?
Calculate:
approval requested timestamp
minus:
approval completed timestamp.
This reduces manual reporting.
Event-Based Metrics
Events such as:
DecisionApproved
NoticeDelivered
ContractExecuted
can power accurate KPI calculations.
This reinforces the value of a strong audit/event architecture.
KPI Snapshotting
For dashboards:
daily or monthly snapshots can improve:
- speed;
- trend analysis.
This is especially useful at enterprise scale.
KPI Exports
Teams may need:
- Excel;
- PDF;
- API.
But the platform should remain:
the authoritative calculation source.
This avoids conflicting spreadsheets.
KPI Auditability
For finance-sensitive metrics:
such as savings,
users should be able to trace:
KPI
→ contract
→ calculation
→ evidence.
This is essential.
Renewal ROI Is the Ultimate Commercial KPI
A prospect may ask:
Why should we pay for this software?
The strongest answer is not:
It sends reminders.
It is:
Because the system helps the organization control recurring supplier spend, prevent avoidable renewal costs, improve negotiations, and measure the financial value created.
This is where the KPI framework directly supports SaaS sales.
Example Platform Value Scorecard
Annual subscription:
€24K.
Renewal-related value tracked:
Hard savings:
€320K.
Avoided unwanted renewal:
€120K.
Administrative time value:
€25K.
Total tracked value:
€465K.
Value-to-cost:
approximately:
19×
Again, different benefit categories should remain clearly identified.
Break-Even Rate
Managed renewal spend:
€25M.
Platform cost:
€25K.
Break-even improvement:
0.1%
This is an extremely compelling economic comparison.
KPI Framework as a Sales Asset
This article itself can also become:
- downloadable checklist;
- lead magnet.
For example:
Download the 25-Point Contract Renewal KPI Checklist
That could capture prospect emails.
It is particularly suitable because users searching for:
- procurement KPIs;
- contract-management metrics;
may already be experiencing renewal-process problems.
SEO Opportunity
This topic can attract searches around:
contract renewal KPIs
contract management KPIs
procurement savings metrics
renewal management metrics
contract lifecycle KPIs
These queries can introduce prospects who may not initially search for:
Contract Renewal Tracker software.
Commercial CTA Placement
For this article, I would use three strong CTA locations.
The first is immediately after the opening problem:
See how Contract Renewal Tracker calculates renewal KPIs automatically →
The second is after the 25-KPI framework:
Replace spreadsheet-based KPI reporting with a live renewal dashboard →
And the strongest CTA is near the end:
Start tracking renewal performance, savings, risk, and ROI in one Contract Renewal Tracker workspace →
This keeps the article commercially focused without making every section promotional.
Ready to Measure the Performance of Your Entire Renewal Process?
A renewal program should be able to demonstrate more than:
how many contracts it manages.
Contract Renewal Tracker is designed to measure whether the organization is:
- acting earlier;
- reducing risk;
- preventing unwanted renewals;
- negotiating better outcomes;
- forecasting more accurately;
- realizing savings.
Use Contract Renewal Tracker to monitor:
- renewal exposure;
- risk exposure;
- decision coverage;
- undecided spend;
- auto-renewal exposure;
- missed deadlines;
- notice compliance;
- business-review completion;
- hard savings;
- cost avoidance;
- demand reduction;
- supplier inflation;
- negotiation cycle time;
- approval performance;
- forecast accuracy;
- renewal ROI.
The objective is to move from:
“We manage contract renewals.”
to:
“We can prove how well the renewal process performs, where it is improving, where it is failing, and what financial value it creates.”
Start Your Contract Renewal Tracker Subscription →
Final Thoughts
Contract renewal maturity becomes much easier to improve once it becomes measurable.
The model is:
Activity
↓
Measurement
↓
Insight
↓
Intervention
↓
Improvement
Without KPIs:
teams rely on impressions.
With KPIs:
management can see:
how early decisions happen,
where financial exposure sits,
how often deadlines are protected,
how much spend is optimized,
and:
whether forecasting is improving.
For Contract Renewal Tracker, this KPI framework is especially important because it demonstrates that the platform is not merely a place where contracts are stored.
It becomes the system organizations use to measure the quality, financial impact, and maturity of the entire renewal operating model.
Next Article in the Contract Renewal Tracker Series
Article 73 — “Contract Renewal Maturity Model: How to Move from Spreadsheets and Manual Reminders to Automated, AI-Assisted Renewal Operations”
The next article will organize many of the capabilities developed throughout the series into a five-level maturity model—from reactive spreadsheet tracking through structured workflows, integrated renewal operations, predictive intelligence, and finally AI-assisted portfolio optimization.
This should be a particularly strong prospect-conversion article because readers will be able to identify exactly where their organization sits today, what problems appear at that maturity level, and why moving to Contract Renewal Tracker becomes the logical next step.

