Organizations negotiate hundreds or thousands of contracts over time.
Every renewal creates useful commercial information.
What price did the supplier originally propose?
What final price was agreed?
How much did the supplier move?
What notice period was accepted?
What payment terms were achieved?
How long did negotiation take?
How much savings were validated?
Which supplier performed best?
Which business unit consistently negotiated stronger terms?
Too often, those lessons disappear into:
- old spreadsheets;
- email threads;
- procurement folders;
- individual buyer experience.
That means each new renewal starts with less intelligence than it should.
A dedicated Contract Renewal Tracker can turn historical renewal data into an internal benchmarking system.
Instead of asking:
What do we think a good renewal outcome looks like?
procurement can begin asking:
What have we actually achieved before, where are the outliers, and how should that influence the negotiation we are about to enter?
That is the role of contract renewal benchmarking.
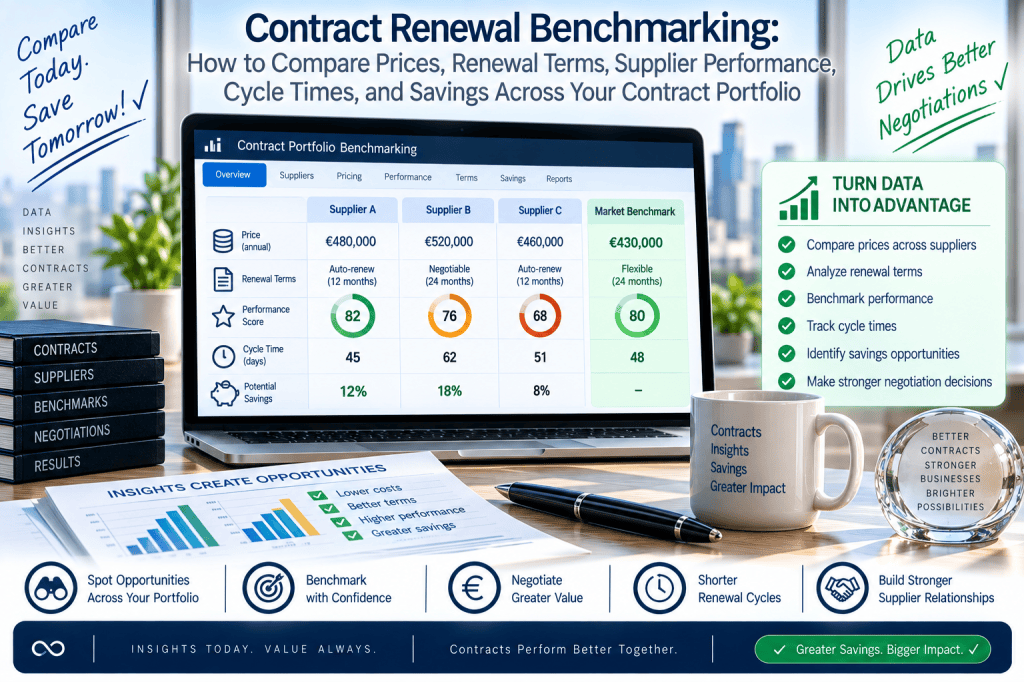
What Is Contract Renewal Benchmarking?
Contract renewal benchmarking is the comparison of commercial and operational renewal data across:
- suppliers;
- contracts;
- business units;
- regions;
- categories;
- previous renewal cycles.
The objective is to establish useful reference points.
For example:
What is the typical SaaS price increase in our portfolio?
What is the best internal price we currently pay this supplier?
How long do strategic negotiations normally take?
What is the average notice period in this category?
Which suppliers consistently demand the largest increases?
Which renewal strategies produce the strongest savings?
These benchmarks can make future decisions more informed.
Your Best Benchmark May Already Be Inside Your Own Contract Portfolio
Before paying for external market benchmarks, organizations may already have valuable commercial comparisons hidden across their existing supplier agreements.
Contract Renewal Tracker is designed to preserve historical renewal outcomes and turn them into internal pricing, term, performance, and process benchmarks.
Use every completed renewal to negotiate the next one more intelligently →
Why Internal Benchmarking Matters
Suppose three departments buy the same software product.
Department A
€42 per user.
Department B
€56 per user.
Department C
€49 per user.
Without a centralized system, none of the departments may know about the others.
Now procurement can see:
Best Internal Price: €42.
Highest: €56.
Spread: 33%.
That creates immediate negotiation intelligence.
Benchmark 1: Unit Price
Headline contract value is often misleading because quantities differ.
For comparison, normalize to:
Price per User
Price per Device
Price per Site
Price per Transaction
depending on the category.
Example
Contract A:
1,000 licenses.
€500K.
Unit price:
€500.
Contract B:
400 licenses.
€240K.
Unit price:
€600.
Contract B is 20% more expensive on a unit basis.
This may deserve investigation.
Normalization Is Essential
Two contracts cannot be compared fairly if:
- scope differs;
- service levels differ;
- regions differ;
- volumes differ.
A good benchmark should show:
Comparable
or:
Not Fully Comparable
rather than pretending every price difference is meaningful.
Benchmark Confidence
For example:
High Confidence
Same product, same edition, similar volume.
Medium
Same product, different geography.
Low
Same category, materially different scope.
This keeps comparisons credible.
Benchmark 2: Supplier Pricing Variance
Suppose one supplier has eight agreements.
Unit pricing ranges from:
€38
to:
€61.
The system can calculate:
Minimum
Median
Average
Maximum
Now procurement knows where each contract sits.
Pricing Percentile
A contract could show:
Your current unit price is in the 82nd percentile of your organization’s internal pricing for this supplier.
That means the business is paying relatively high compared with internal peers.
This is a useful negotiation trigger.
Benchmark 3: Supplier Opening Price Increase
Historical proposals can show supplier behavior.
For example:
Supplier A historically opens renewals with:
+12%.
Supplier B:
+5%.
Supplier C:
+18%.
This helps procurement prepare.
Opening vs Final Increase
Suppose Supplier A:
Average opening increase:
12%.
Average final increase:
4%.
Average supplier movement:
8 percentage points.
That tells buyers:
the opening proposal is rarely the final position.
Supplier Movement Benchmark
This can be very powerful.
For example:
ExampleCloud
Opening increase:
11.8%.
Final:
3.6%.
Average movement:
8.2%.
DataWorks
Opening:
6.1%.
Final:
4.9%.
Movement:
1.2%.
The negotiation strategy should differ.
Benchmark 4: Hard Savings
Compare validated hard savings across similar renewals.
For example:
Software category:
Median hard savings:
4%.
Top quartile:
8%.
This does not mean every buyer should target 8%.
But it provides useful context.
Savings Rate
Formula:
Validated Hard Savings ÷ Comparable Baseline
For example:
€40K savings
on:
€500K baseline
=
8%
This can be compared across renewals.
Benchmark 5: Cost Avoidance
Supplier increases can also be benchmarked.
Example:
Average proposed increase:
10%.
Average final increase:
4%.
Average avoided increase:
6 percentage points.
This gives procurement a portfolio-level view of negotiation effectiveness.
Benchmark 6: Demand Reduction
Some of the strongest renewal savings may come from buying less.
For SaaS:
Median license reduction:
6%.
High-opportunity renewals:
20%+.
This helps identify categories where utilization reviews matter most.
Demand Optimization Benchmark
For example:
CRM contracts:
Average utilization:
82%.
Project management:
61%.
AI tools:
48%.
Now procurement knows where license optimization efforts may produce the most value.
Benchmark 7: Contract Term
How long do contracts typically run?
For example:
Software:
Median 24 months.
Professional services:
12 months.
Cloud:
36 months.
Strategic outsourcing:
48 months.
Outliers can be identified.
Term Outlier Alert
Suppose:
Category median:
24 months.
Supplier proposes:
60 months.
Contract Renewal Tracker can flag:
Proposed term is 2.5× the category median.
That does not make it wrong.
But it deserves scrutiny.
Benchmark 8: Auto-Renewal Term
Some suppliers may use:
12-month auto-renewal.
Others:
36-month.
A portfolio benchmark can reveal:
Most comparable contracts renew for 12 months; this supplier requests 36.
This creates negotiation leverage.
Benchmark 9: Notice Period
For example:
Software median:
90 days.
Cloud:
120 days.
Professional Services:
60 days.
A supplier requesting:
180 days
may be an outlier.
Notice Period Outlier
The system could say:
Proposed 180-day notice period is twice the internal median for comparable software agreements.
This gives legal and procurement useful context.
Benchmark 10: Price Escalation Cap
A renewal may include an annual cap.
For example:
Comparable agreements:
Median:
3%.
Current supplier:
7%.
The system can flag:
Escalation Above Benchmark
This can become a negotiation objective.
Price Cap Benchmark
For example:
Best Internal
2%.
Median
3%.
Current
5%.
Supplier Proposal
8%.
Now the commercial gap is obvious.
Benchmark 11: Payment Terms
Supplier contracts may vary significantly.
For example:
30 days.
45 days.
60 days.
90 days.
If the same supplier gives another division:
60 days
while your contract has:
30,
that becomes negotiation leverage.
Payment Term Benchmark
Current:
Net 30.
Supplier internal best:
Net 60.
Recommendation:
Consider requesting alignment with the supplier’s strongest existing internal payment terms.
This is a concrete procurement action.
Benchmark 12: Renewal Cycle Time
Not all benchmarking is financial.
Measure:
Workflow Start → Renewal Completion
For example:
Low-value SaaS:
28 days.
Strategic software:
124 days.
Outsourcing:
210 days.
This helps determine when future workflows should begin.
Cycle-Time Benchmark
Suppose a strategic cloud renewal historically takes:
170 days.
Your workflow starts:
90 days before notice deadline.
That is a planning problem.
Historical data can prove it.
Benchmark 13: Negotiation Duration
Measure:
First Supplier Proposal → Final Commercial Agreement
For example:
Supplier A:
Average 62 days.
Supplier B:
Supplier C:
This helps buyers set realistic schedules.
Supplier Response Benchmark
Example:
Average supplier response:
6 days.
Current negotiation:
14 days.
The system can flag:
Supplier response is materially slower than historical norm.
This may justify escalation.
Benchmark 14: Legal Review Cycle Time
Legal teams can compare:
Category.
Region.
Contract complexity.
For example:
Standard renewal:
5 days.
Material amendment:
12 days.
Current review:
19 days.
This indicates a bottleneck.
Benchmark 15: Approval Cycle Time
Finance approval:
Median:
2.8 days.
Executive:
4.1.
If one renewal remains pending:
12 days,
the system can classify it as an outlier.
Operational Benchmarks Help Forecasting
Historical cycle times can improve:
- workflow start dates;
- workload forecasts;
- escalation rules.
This is a key link between benchmarking and renewal operations.
Benchmark 16: Supplier Performance
Compare:
- SLA;
- support;
- incidents;
- satisfaction.
For example:
Category average:
82/100.
Supplier:
That should influence renewal strategy.
Performance vs Price
A supplier may be:
15% more expensive
and:
20% lower-performing
than comparable alternatives.
This creates a strong review signal.
Value Benchmark
One useful model combines:
Price
and:
Performance
For example:
High price + high performance:
possibly justified.
High price + low performance:
priority renegotiation or replacement.
Benchmark 17: Renewal Risk
Compare risk levels across:
- departments;
- categories;
- suppliers.
For example:
IT:
18% High/Critical.
Marketing:
7%.
Why?
Perhaps IT contracts have:
- longer migration lead times;
- later workflow starts.
Benchmarking reveals structural differences.
Benchmark 18: Missed Deadline Rate
For example:
Enterprise average:
0.5%.
Business Unit A:
2.4%.
This indicates a process problem.
Benchmark 19: Owner Response Time
Average business-review response:
5 days.
Marketing:
11 days.
This can explain why Marketing renewals start late.
Benchmark 20: Workflow Escalation Rate
Portfolio average:
12%.
Department X:
32%.
This could indicate:
- wrong owners;
- poor notification timing;
- excessive complexity.
Operational benchmarking turns anecdotal issues into measurable evidence.
Benchmark Across Business Units
A dashboard might compare:
| Metric | IT | Marketing | HR |
|---|---|---|---|
| On-Time Workflow Start | 94% | 71% | 88% |
| Hard Savings | 5.2% | 3.1% | 4.0% |
| Owner Response | 4 days | 11 days | 6 days |
| High-Risk Renewals | 9% | 18% | 7% |
This helps identify both:
- problems;
- best practices.
Benchmarking Should Not Become a Punitive Ranking System
Different teams manage different:
- suppliers;
- contract types;
- markets.
The purpose should be:
understand
and:
improve
not:
simplistic employee scoring.
Context matters.
Best-Practice Identification
Suppose IT achieves:
- earlier workflow starts;
- stronger savings;
- lower escalation.
The organization can study:
what IT is doing differently
and potentially reuse the playbook elsewhere.
This converts benchmarking into process improvement.
Benchmark by Category
For example:
Software
Median savings:
5%.
Cycle time:
75 days.
Telecom
Savings:
8%.
Cycle:
110 days.
Professional Services
Savings:
4%.
Cycle:
55 days.
This helps procurement plan category-specific strategies.
Benchmark by Supplier
Supplier-level benchmarks are especially useful.
For example:
ExampleCloud
Historical Negotiations:
Average Opening Increase:
12%.
Average Final Increase:
4%.
Average Cycle:
58 days.
Best Internal Price:
€44/user.
Current Proposal:
€57/user.
This is a powerful negotiation brief.
Benchmark by Geography
International portfolios may compare:
Europe.
US.
APAC.
But factors such as:
- taxes;
- regulatory requirements;
- regional pricing;
must be normalized.
Raw comparisons can be misleading.
Currency Normalization
If comparing:
GBP
and:
EUR,
choose a consistent methodology.
For example:
corporate budget FX rates.
The system should show the rate/method.
Normalize Scope Before Price
Suppose:
US contract includes premium support.
EU contract does not.
A direct unit-price comparison may be misleading.
The benchmark should include:
scope differences.
Comparable Groups
A mature system could group contracts into comparable cohorts.
For example:
Supplier + Product + Edition + Region + Volume Band
Then benchmarking becomes much more precise.
Volume Bands
For example:
1–100 users.
101–500.
501–1,000.
1,000+.
A 100-user contract should not necessarily be benchmarked directly against a 10,000-user enterprise agreement.
Benchmark Confidence Score
A comparison might show:
Confidence: 91%
because:
- same supplier;
- same product;
- similar volume.
Another:
Confidence: 48%
because:
- different scope;
- different region.
Again, explainability matters more than the exact score.
Internal vs External Benchmarks
Internal benchmarking is valuable because it uses:
actual contracted outcomes.
External benchmarking can add:
market context.
The two should complement each other.
Internal Benchmark
Answers:
What have we achieved?
External benchmark:
What does the broader market appear to achieve?
Both can inform negotiation.
Do Not Assume External Benchmark Is Automatically Better
Third-party benchmarks may be:
- outdated;
- incomplete;
- not comparable.
Internal contract data may be highly relevant.
The strongest decision uses several sources.
Benchmark Freshness
Pricing changes.
A benchmark from:
five years ago
may be less relevant than:
last quarter.
The system should weight recency.
Recency Weighting
For example:
0–12 months:
High relevance.
12–24:
Medium.
24+:
Lower.
This improves benchmark quality.
Benchmark Sample Size
If only:
one comparable contract exists,
the system should say so.
For example:
Benchmark based on one internal comparison.
That is very different from:
Benchmark based on 48 comparable contracts.
Sample Size Matters
A benchmark dashboard should show:
N = 3
or:
N = 42
This gives users the context needed to interpret it.
Outlier Handling
One unusual contract can distort averages.
That is why:
Median
can be more useful than:
Average
for some metrics.
Contract Renewal Tracker can show:
- median;
- quartiles;
- range.
Example
Unit prices:
€40.
€41.
€42.
€43.
€90.
Average:
€51.2.
Median:
€42.
The median better represents the normal portfolio.
Percentiles
A contract might show:
Current price:
75th percentile.
Supplier proposal:
95th percentile.
Procurement target:
40th percentile.
This gives an intuitive negotiation picture.
Benchmark Alerts
The system could automatically flag:
Proposed price is 28% above internal median.
Notice period is in the 95th percentile for comparable contracts.
Payment terms are materially worse than internal benchmark.
These become negotiation inputs.
Benchmark-Driven Negotiation Target
The system should not automatically set the target.
But it can suggest:
Comparable internal contracts indicate a €45–€49 per-user range.
Procurement can decide:
Target:
€44.
Acceptable:
€48.
This improves preparation.
Benchmark Guardrails
If final terms are:
materially worse than benchmark,
the system could trigger:
Procurement Exception Review
For example:
IF final_unit_price > benchmark_median * 1.20THEN procurement_exception_required = TRUE
This is optional governance.
Benchmark Against Your Own Previous Renewal
The simplest comparison is longitudinal.
For example:
Last renewal:
€50/user.
Current proposal:
€57.
Increase:
14%.
Historical negotiated increase:
4%.
This creates useful context.
Trend Analysis
A supplier may show:
2026:
€42.
2027:
€45.
2028:
€49.
2029 Proposal:
€57.
The acceleration itself is an important signal.
Supplier Inflation Trend
Historical annual increases:
7%.
9%.
16%.
The system can flag:
Supplier pricing inflation is accelerating.
That may justify sourcing review.
Benchmark Savings Over Time
Procurement could compare:
2027:
3.8%.
2028:
5.2%.
2029:
6.1%.
This may show increasing effectiveness.
Benchmark Cycle Time Over Time
Average renewal cycle:
92 days → 78 → 64.
The process is becoming more efficient.
This is useful operational evidence.
Benchmark Notice Compliance Over Time
Missed deadline rate:
2.1% → 0.8% → 0.2%.
This demonstrates maturity.
Benchmarking Makes the Platform Smarter Over Time
This creates an important product dynamic.
In Year 1, Contract Renewal Tracker knows:
current contracts.
In Year 2, it also knows:
last year’s renewal outcomes.
In Year 3:
it has several cycles of supplier behavior, pricing, and workflow data.
The platform becomes increasingly valuable as historical data accumulates.
Data Network Effect Within the Customer
This is not necessarily a cross-customer network effect.
It is an organizational learning effect.
More renewal history creates:
better internal benchmarks.
That makes switching away from the system potentially more costly because the historical intelligence is valuable.
Supplier Memory + Benchmarking
For example:
ExampleCloud has negotiated seven renewals with your organization. Its average opening price increase is 12.1%, average final increase is 4.2%, and average negotiation duration is 61 days.
This becomes powerful institutional knowledge.
AI-Assisted Benchmarking
The AI assistant can make benchmark data easier to use.
A buyer asks:
Is this supplier proposal expensive?
The assistant could answer:
The proposed €57 per-user price is 27% above the €45 internal median across five comparable contracts and 14% above your own current unit price. The highest internal comparable price is €51.
Now the buyer has immediate context.
Ask AI: What Should Our Target Be?
The assistant could say:
Comparable contracts suggest €43–€48 per user. Your strongest internal agreement is €42. Based on volume and current scope, a target in the mid-€40s may be reasonable, but this should be validated against regional and service-level differences.
This is decision support, not automatic pricing authority.
Ask AI: Is the Notice Period Unusual?
Response:
The supplier’s proposed 180-day notice period is longer than 92% of comparable software contracts in your portfolio, where the median is 90 days.
This gives legal and procurement leverage.
Ask AI: Which Suppliers Are Hardest to Negotiate?
The system might use:
- supplier movement;
- cycle time;
- concession history.
For example:
Supplier A historically moves only 1.8% from its opening position and takes 83 days on average to reach final terms.
That helps future planning.
Ask AI: Where Are We Underperforming?
For example:
Marketing renewals have 24% lower on-time workflow starts and 18% lower validated savings rates than the portfolio median. The main process difference is later business-owner engagement.
This turns benchmarking into improvement.
Ask AI: Which Business Unit Has the Best SaaS Terms?
The system can compare:
- unit price;
- escalation cap;
- payment terms.
This creates internal best-practice discovery.
AI Should Explain Comparability
If the assistant says:
Department A has the best price,
it should also say:
Its contract covers 3,000 users, roughly three times the volume of Department B.
That prevents misleading conclusions.
AI Benchmark Brief
Before negotiation:
Current Price
€52/user.
Internal Median
€45.
Best Comparable
€42.
Supplier Proposal
€58.
Historical Supplier Final Average
€48.
Negotiation Cycle Benchmark
60 days.
This is an excellent procurement preparation tool.
Benchmarking Dashboards
Procurement may want several views.
Price Benchmarks
Unit economics.
Contract Terms
Notice, term, escalation.
Supplier Behavior
Proposal/final movement.
Process Performance
Cycle time, approvals.
Savings
Hard savings and avoidance.
This creates a complete internal benchmark library.
Supplier Benchmark Dashboard
For example:
Supplier X
Contracts:
Annual Spend:
€8.4M.
Unit Price Spread:
22%.
Median Notice:
90 days.
Average Opening Increase:
11%.
Average Final Increase:
4%.
Negotiation Cycle:
58 days.
This is highly actionable.
Category Benchmark Dashboard
For example:
SaaS
Contracts:
Median Term:
24 months.
Median Notice:
90 days.
Median Increase:
4.8%.
Median Hard Savings:
5.1%.
Average Cycle:
72 days.
This provides category context.
Business Unit Benchmark Dashboard
For example:
IT
On-Time Start:
95%.
Savings:
6.2%.
Cycle:
82 days.
Marketing
On-Time:
78%.
Savings:
3.4%.
Cycle:
101 days.
This helps process optimization.
Executive Benchmark Dashboard
Executives do not need detail.
They might see:
Renewal Savings vs Prior Year
Cycle Time vs Prior Year
Missed Deadline Rate
Price Inflation vs Prior Year
High-Risk Exposure
This shows whether renewal operations are improving.
Confidentiality
Benchmarking can involve sensitive commercial information.
Access should be controlled carefully.
A business user may see:
Your price is above internal benchmark.
But not necessarily:
Department X pays €42.
This protects internal confidentiality.
Anonymous Internal Benchmarking
The system could say:
Best internal comparable: €42.
without identifying which business unit has the contract.
This can be useful.
Private Equity and Cross-Company Benchmarking
For PE portfolios, benchmarking across companies could be valuable.
But it requires very strong:
- tenant isolation;
- permission;
- confidentiality;
- legal governance.
It should never be assumed that portfolio companies may see each other’s commercial terms.
Benchmarking and Competition Law
Cross-company or industry benchmarking can raise legal and competition concerns depending on context and jurisdiction.
Organizations should apply appropriate legal governance, especially when sharing current pricing data across independent businesses.
For a normal single-company internal benchmark, the considerations are different.
Benchmark Data Governance
Administrators should define:
- who can see raw comparisons;
- who can see aggregated benchmark statistics;
- minimum sample sizes.
This makes the feature enterprise-ready.
Minimum Sample Thresholds
For example:
Do not show aggregated benchmark:
if sample <3.
This can help protect confidentiality in cross-unit analysis.
Benchmark Provenance
Every benchmark should answer:
Which records contributed?
Authorized users should be able to inspect the comparison set.
This improves trust.
Benchmark Versioning
Benchmarks change as new renewals close.
A target set in January may have been based on:
median €48.
By June:
median €45.
Historical approval records should preserve the benchmark context available at that time where needed.
Benchmark Quality Score
A benchmark could be scored using:
- sample size;
- recency;
- comparability;
- verification.
For example:
Benchmark Quality: High
N=18.
Median age:
8 months.
Same product family.
This helps users judge reliability.
Do Not Let Benchmarks Become Automatic Truth
A benchmark is evidence.
It is not a substitute for judgment.
A higher price may be justified by:
- better SLA;
- different geography;
- lower volume;
- additional functionality.
The system should help users understand the difference.
Benchmarking + Workflow Automation
If a contract is materially outside benchmark:
automatically create:
Commercial Review
For example:
Unit price 35% above internal median.
That turns intelligence into action.
Benchmarking + Risk
A contract with:
high price
poor performance
near-term renewal
may receive stronger priority.
This is where benchmarking becomes part of renewal intelligence.
Benchmarking + Savings Forecast
If internal median suggests:
8% pricing improvement is plausible,
the system might identify:
Potential Savings Opportunity
without treating it as guaranteed.
This can feed the savings pipeline.
Benchmarking + AI Next-Best Action
For example:
Request pricing alignment with the best comparable internal contract before accepting the supplier’s 9% increase.
This is an evidence-based recommendation.
Benchmark KPI Set
Useful metrics include:
Unit Price Variance
Supplier Opening Increase
Supplier Final Increase
Supplier Movement
Median Notice Period
Median Term
Escalation Cap
Negotiation Cycle Time
Hard Savings Rate
Approval Cycle Time
These create a rich internal knowledge base.
Benchmark Maturity
A useful progression is:
Level 1
No historical comparison.
Level 2
Prior-contract comparison.
Level 3
Supplier internal benchmarking.
Level 4
Category benchmarking.
Level 5
AI-assisted predictive benchmarks.
Contract Renewal Tracker can support this evolution.
Predictive Benchmarking
With enough historical data, the system may eventually estimate:
Similar renewals typically settle between €460K and €490K.
This can guide negotiation preparation.
It should clearly remain a prediction, not a guaranteed market price.
Supplier Outcome Forecast
For example:
Based on previous five negotiations:
Supplier opening:
€575K.
Expected final range:
€510K–€530K.
Confidence:
Medium.
Procurement can use this as one input.
Benchmarking Improves Forecasting
Historical:
- supplier movement;
- cycle time;
- savings;
can improve future:
- budget forecasts;
- workflow timing;
- savings forecasts.
This creates a powerful feedback loop.
The Learning Loop
Every completed renewal contributes:
Pricing
Terms
Cycle Time
Supplier Behavior
Savings
↓
Benchmark Library
↓
Next Renewal Strategy
↓
Better Outcome
Then the next outcome enters the library.
This is cumulative organizational learning.
Contract Renewal Tracker as Institutional Procurement Memory
This is an important product positioning.
Procurement knowledge should not remain only in the heads of individual buyers.
The system can preserve:
What did we pay?
What did the supplier ask?
What did we get?
How long did it take?
What worked?
This makes the organization stronger over time.
Ready to Make Every Renewal Smarter Than the Last?
Organizations accumulate valuable commercial experience every time they negotiate a contract.
That experience should not disappear when the renewal closes.
Contract Renewal Tracker is designed to preserve historical renewal outcomes and transform them into practical internal benchmarks for future negotiations.
Use Contract Renewal Tracker to:
- compare unit pricing;
- measure supplier price variance;
- benchmark supplier opening increases;
- measure supplier movement;
- compare savings rates;
- benchmark contract terms;
- compare notice periods;
- compare escalation caps;
- benchmark payment terms;
- measure renewal cycle time;
- compare approval and legal-review performance;
- identify internal best pricing;
- analyze supplier negotiation history;
- normalize comparisons by scope and volume;
- use AI to explain whether a proposed deal looks unusual and why.
The objective is to move from:
“What did we negotiate last time?”
to:
“We know exactly how this proposal compares with our historical outcomes, internal pricing, contract terms, and supplier behavior—and we can use that evidence to negotiate from a stronger position.”
Start Your Contract Renewal Tracker Subscription →
Final Thoughts
Benchmarking turns renewal history into reusable commercial intelligence.
Without it:
Contract closes
↓
Knowledge disappears
With Contract Renewal Tracker:
Contract closes
↓
Outcome captured
↓
Benchmark updated
↓
Next negotiation improves
The value compounds over time.
After one renewal, the system knows:
a contract.
After ten renewals, it knows:
a supplier.
After hundreds of renewals, it begins to understand:
the organization’s commercial patterns.
That is a significant shift.
Contract Renewal Tracker becomes not merely the place where future renewals are managed, but the place where the organization remembers how it negotiated previous ones and what a good outcome actually looks like.
Next Article in the Contract Renewal Tracker Series
Article 60 — “Contract Renewal Supplier Scorecards: How to Combine Performance, Cost, Risk, Service Quality, and Renewal History Before You Decide to Renew”
The next article will focus on supplier evaluation before renewal. It will cover SLA performance, service quality, business satisfaction, incident history, supplier responsiveness, pricing competitiveness, renewal behavior, security and third-party risk, financial health, strategic importance, dependency, improvement plans, weighted supplier scores, renewal recommendations, and AI-generated supplier briefs.
This should be another strong prospect-focused article because it moves the renewal decision from:
“The contract is expiring—should we renew?”
toward:
“Based on everything we know about this supplier, have they actually earned the next contract term?”

