Contract renewal management becomes significantly more effective when it is measurable.
Without metrics, organizations often manage renewals reactively.
Teams know when a major problem happens.
They know when a deadline is missed.
They know when procurement saves money.
They know when legal becomes overloaded.
But they may not know whether the overall renewal process is actually improving.
A dedicated Contract Renewal Tracker can turn renewal operations into a measurable management discipline by tracking the KPIs that matter across:
- finance;
- procurement;
- legal;
- vendor management;
- business ownership;
- executive leadership.
The objective is not to create dozens of dashboards simply because the data exists.
It is to answer a smaller set of important questions:
Are we seeing renewals early enough?
Are the right people taking action?
Are we preventing unwanted commitments?
Are we capturing commercial value?
Where is risk increasing?
Can management trust the forecast?
Those questions should define the renewal KPI framework.
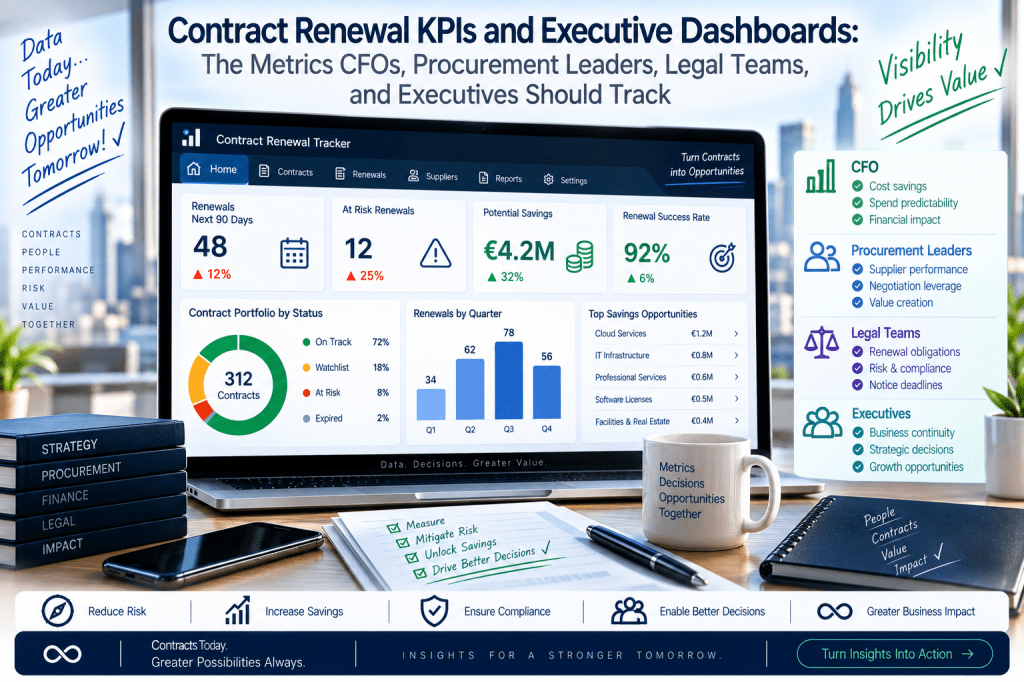
Why Contract Renewal KPIs Matter
A contract-renewal process can appear functional while still containing significant hidden weaknesses.
For example:
98% of renewals may eventually complete.
That sounds good.
But perhaps:
- 30% started late;
- €4M of spend reached notice deadlines without a decision;
- procurement had only 20 days to negotiate;
- legal approvals repeatedly caused delays;
- savings were never measured.
A completion metric alone would hide those problems.
A stronger KPI set measures the quality of the renewal process, not simply whether contracts eventually renewed.
Still Managing Renewals Without a Clear Scorecard?
If leadership cannot quickly answer how much spend is approaching renewal, how much remains undecided, which deadlines are at risk, or what financial value the renewal process is creating, the organization is managing contracts without a complete operating picture.
Contract Renewal Tracker is designed to convert renewal activity into clear portfolio, financial, risk, and performance metrics.
Turn renewal activity into measurable management control →
Start with a Small Executive KPI Set
Executives should not receive 50 metrics.
A useful high-level scorecard might include:
- Renewal Value Next 180 Days
- Undecided Renewal Value
- High/Critical Risk Value
- Auto-Renewal Exposure
- Notice-Deadline Compliance
- Savings / Cost Avoidance
- Forecast Variance
- Critical Actions Overdue
These eight metrics tell a strong story.
KPI 1: Renewal Value Next 180 Days
This answers:
How much contract value is approaching a decision window?
For example:
Next 180 Days
Contracts:
412
Annual Value:
€28.4M
This provides context for workload and financial exposure.
Renewal Value by Horizon
Useful horizons include:
30 Days
Immediate execution.
60 Days
Short-term decisions.
90 Days
Procurement pipeline.
180 Days
Planning horizon.
365 Days
Budget and strategic view.
For example:
30 Days:
€2.2M.
90 Days:
€9.8M.
180 Days:
€28.4M.
365 Days:
€61.2M.
This makes the portfolio easier to understand.
KPI 2: Undecided Renewal Value
This is one of the most powerful renewal metrics.
Suppose:
€14M of contracts reach notice deadlines in the next 90 days.
Of that:
€11.5M has an agreed strategy.
€2.5M remains undecided.
Then:
Undecided Renewal Value = €2.5M
This represents decision uncertainty.
Why Undecided Value Matters
An undecided €10,000 contract may be manageable.
An undecided €4 million outsourcing agreement may require executive attention.
That is why the KPI should usually show both:
Count
and:
Value
For example:
Undecided:
37 contracts.
€6.8M.
Decision Coverage KPI
A related metric is:
Contracts with Defined Renewal Strategy ÷ Contracts Requiring Decision
For example:
180 of 200.
Decision Coverage:
90%
The organization might target:
95%.
Decision Coverage by Time Horizon
A more sophisticated view is:
180+ Days Before Deadline
70% defined.
90 Days
90%.
60 Days
97%.
30 Days
100%.
This gives management a maturity target.
KPI 3: Notice-Deadline Compliance
This measures whether the organization acts before contractual notice deadlines.
Formula:
Renewals Completed or Decided Before Notice Deadline ÷ Relevant Renewals
For example:
198 on time.
2 missed.
Compliance:
99%
The ideal target should be extremely high.
Missed Notice Deadline Rate
The inverse metric is:
Missed Notice Deadlines ÷ Relevant Renewals
For example:
2 ÷ 200
=
1%
Even 1% may represent significant financial exposure.
Value of Missed Deadlines
Count alone is not enough.
Suppose:
2 deadlines missed.
Potential commitment exposure:
€1.4M.
That tells a much more serious story.
The dashboard should therefore show:
Missed Deadline Count
and:
Financial Exposure
KPI 4: Auto-Renewal Exposure
This answers:
How much contract spend can renew automatically?
For example:
Auto-Renewing Contracts
482
Annual Value
€18.6M
Decision Outstanding
€3.8M
Notice Deadline <90 Days
€1.4M
This is an excellent executive-risk metric.
Auto-Renewal Decision Coverage
A strong KPI is:
What percentage of auto-renewing contracts have an explicit decision before the notice deadline?
Target:
100%
Because an auto-renewal should never happen merely because nobody acted.
Unwanted Auto-Renewals Prevented
This can also become a financial metric.
For example:
Contracts intentionally terminated before automatic renewal:
Avoided annual spend:
€420K
This is one of the clearest demonstrations of product value.
KPI 5: High/Critical Renewal Risk Value
Count how much contract value is associated with:
High
and:
Critical
renewal risk.
For example:
High:
€11.2M.
Critical:
€4.8M.
Total Elevated Exposure:
€16M
This gives executives a prioritized view.
Risk Count vs Risk Value
Suppose:
50 critical contracts.
That sounds alarming.
But perhaps 45 are worth less than €1,000.
Another company may have:
3 critical contracts
worth:
€20M.
The second situation may be much more serious.
Always show both:
Count
and:
Value
Risk Reduction Rate
This measures how effectively teams resolve elevated risk.
For example:
High/Critical at start of month:
60 contracts.
Reduced to Medium/Low:
Risk Reduction Rate:
70%
This can indicate process effectiveness.
Newly Critical Renewals
A useful weekly metric:
Contracts Entering Critical Status
For example:
7 new.
This supports early intervention.
Time Spent in Critical Status
Measure:
How long does a contract remain Critical before mitigation?
For example:
Average:
11.4 days.
Target:
<5 days.
This tells management whether intervention is fast enough.
KPI 6: Renewal Workflow Start Rate
A contract may be technically “on time” but still start too late.
Measure:
Renewals Started by Required Lead-Time Threshold ÷ Eligible Renewals
For example:
Strategic contracts requiring 180 days:
Started on time:
Start Rate:
88%
Target:
95%.
This is a strong leading indicator.
Why Start Rate Is Better Than Waiting for Missed Deadlines
A missed deadline is a lagging indicator.
A late workflow start is a leading indicator.
If management improves the second, the first should improve automatically.
Early Engagement Rate
Procurement may use:
Percentage of strategic renewals entering procurement review at least 120 days before the notice deadline.
For example:
Target:
95%.
Actual:
78%.
That reveals an upstream problem.
KPI 7: Renewal Cycle Time
Measure the time from:
Workflow Start
to:
Renewal Completion
For example:
Average:
74 days.
This can be segmented by contract type.
Cycle Time by Complexity
Low Value
22 days.
Standard
58 days.
High Value
104 days.
Strategic
188 days.
This provides much better context than one global average.
Stage Cycle Time
The organization can also measure:
Business Review: 9 days
Procurement: 31 days
Legal: 12 days
Finance: 5 days
This identifies bottlenecks.
KPI 8: Business Owner Response Time
Business owners are often the first human decision point.
Measure:
Average Time to Complete Renewal Review
For example:
8.2 days.
Target:
5 days.
This helps improve upstream decision-making.
Business Review Completion Rate
For example:
Renewal reviews due:
Completed on time:
Completion Rate:
80%
This may explain why procurement starts late.
Overdue Owner Reviews
Another useful metric:
17 overdue.
€4.2M associated value.
Again, show both count and financial exposure.
KPI 9: Owner Coverage
Every active contract should have an accountable owner.
Formula:
Contracts with Active Owner ÷ Active Contracts
For example:
1,920 / 2,000
=
96%
The target may be:
99%+.
Critical Owner Gaps
More important:
How many contracts inside the next 90-day window have no active owner?
For example:
That should trigger immediate remediation.
KPI 10: Procurement Negotiation Coverage
For material renewals, measure:
How much renewal spend received active procurement review?
For example:
Eligible renewing spend:
€20M.
Procurement reviewed:
€16M.
Coverage:
80%
This can help procurement demonstrate influence.
Procurement Coverage by Value Tier
High-value contracts:
98%.
Low-value:
45%.
That may be intentional.
The goal is not necessarily 100% procurement involvement.
It is appropriate involvement.
KPI 11: Negotiation Savings
Procurement should measure financial outcomes.
Useful categories include:
Hard Savings
Cost Avoidance
Demand Reduction
Avoided Spend
These should remain separated.
Hard Savings KPI
For example:
Current annual baseline:
€18M.
Final comparable spend:
€17.2M.
Hard Savings:
€800K
This reflects actual reduction versus baseline.
Cost Avoidance KPI
Supplier proposals:
€19.5M.
Final negotiated spend:
€17.2M.
Cost Avoidance:
€2.3M
This shows price increases or proposed costs avoided.
Avoided Spend KPI
Terminated contracts:
€1.1M.
This can be reported separately.
Savings Rate
Formula:
Validated Savings ÷ Addressable Renewal Spend
For example:
€1M ÷ €20M
=
5%
This allows comparison over time.
Finance-Validated Savings
Official executive reporting should ideally show:
Finance-Validated Savings
rather than preliminary procurement estimates.
For example:
Procurement reported:
€1.4M.
Finance validated:
€1.2M.
Executive dashboard:
€1.2M
This increases credibility.
KPI 12: Savings Pipeline Coverage
Suppose annual savings target:
€3M.
Validated pipeline:
€5.4M.
Coverage:
1.8×
This helps management understand whether enough opportunities exist to reach the target.
Weighted Savings Forecast
The dashboard might show:
Raw Pipeline:
€6M.
Probability-Weighted:
€3.8M.
Target:
€3M.
This gives a more realistic outlook.
KPI 13: Supplier Price Increase Exposure
This shows how much additional spend suppliers are proposing.
For example:
Current renewing spend:
€20M.
Supplier proposals:
€21.6M.
Increase Exposure:
€1.6M
Procurement can then show how much is being mitigated.
Average Proposed Increase
For example:
8.1%.
Average final increase:
3.4%.
This demonstrates negotiation impact.
Increase Exposure by Category
Software:
11%.
Cloud:
8%.
Telecom:
3%.
Professional Services:
6%.
This helps identify inflation pressure.
KPI 14: Approval Cycle Time
Measure:
Approval Request → Final Approval
For example:
Finance:
3.2 days.
Legal:
7.4 days.
Executive:
5.8 days.
This helps identify governance bottlenecks.
Approval SLA Compliance
For example:
Finance target:
3 days.
On-time:
86%.
Legal target:
7 days.
On-time:
91%.
This allows functional improvement.
Overdue Approval Value
A particularly useful metric:
Pending approvals overdue:
€8.4M.
This immediately gets management attention.
KPI 15: Reapproval Rate
If contracts repeatedly require reapproval because final terms changed, the process may be unstable.
Formula:
Renewals Requiring Reapproval ÷ Approved Renewals
For example:
14%.
A high rate may indicate approvals happen too early.
KPI 16: Legal Review Rate
Not every renewal requires legal review.
Measure:
Percentage routed to legal.
For example:
32%.
If legal is reviewing 95% of unchanged contracts, workflow rules may need simplification.
Legal Review SLA
Measure:
Average Review Time
and:
On-Time Review Rate
For example:
Average:
6.4 days.
SLA:
7 days.
On-Time:
92%.
This supports legal operations.
Legal Risk Backlog
Examples:
Unverified notice terms:
Conflicting amendments:
Termination notices pending:
This gives legal leadership a manageable exception list.
KPI 17: Contract Data Quality
Automation is only reliable when the underlying data is reliable.
Useful metrics include:
Active Owner Coverage
Verified Notice Terms
Known Auto-Renewal Status
Contract Value Coverage
Current Document Coverage
For example:
Verified notice terms:
94%.
Auto-renewal known:
97%.
Owner coverage:
98%.
Critical Data Quality
The more important metric may be:
What percentage of high-value contracts have complete critical renewal data?
For strategic contracts, target:
100%
This is more meaningful than portfolio-wide completeness.
KPI 18: Forecast Accuracy
If Contract Renewal Tracker provides forecasts, management should measure their accuracy.
For example:
Forecasted Q4 renewal spend:
€24M.
Actual:
€25.1M.
Variance:
4.6%
Over time, forecasts should improve.
Savings Forecast Accuracy
Forecasted savings:
€1.4M.
Actual finance-validated:
€1.2M.
Variance:
14.3%.
This helps procurement calibrate expectations.
Workload Forecast Accuracy
Projected legal reviews:
Actual:
This helps capacity planning.
KPI 19: Undecided Spend Trend
The point-in-time figure matters.
The trend matters more.
For example:
January:
€8M.
February:
€6M.
March:
€3.5M.
April:
€1.8M.
This shows decision uncertainty is declining.
KPI 20: Supplier Performance at Renewal
For strategic suppliers, a renewal scorecard may include:
- SLA;
- incidents;
- support;
- business satisfaction.
For example:
Suppliers renewing with performance below threshold:
Annual value:
€14M.
This can influence negotiation strategy.
KPI 21: Supplier Concentration
Measure the percentage of spend concentrated among top suppliers.
For example:
Top 10 suppliers:
42% of managed spend.
This can inform dependency and sourcing strategy.
Renewal Concentration by Supplier
A more renewal-specific metric:
How much supplier spend renews in the same period?
For example:
Supplier X:
€8M total spend.
€6M renews within six months.
Renewal Concentration:
75%
That creates a major negotiation opportunity.
KPI 22: Supplier Consolidation Opportunities
Count and value of situations where:
- multiple contracts;
- same supplier;
- overlapping renewal windows.
For example:
14 opportunities.
Combined addressable spend:
€22M.
This can become a procurement pipeline.
KPI 23: Contract Termination Rate
Measure:
What percentage of reviewed contracts are intentionally terminated?
For example:
5%.
This does not necessarily mean higher is better.
But it can show whether the organization is actively challenging recurring spend.
Avoided Renewal Value
For example:
Terminated contracts:
€1.8M annual spend.
This may be one of the strongest cost-control metrics.
KPI 24: Reduce / Renegotiate / Renew Mix
A useful outcome distribution might show:
Renew As-Is:
52%.
Renegotiate:
27%.
Reduce:
8%.
Terminate:
6%.
Replace:
4%.
Temporary Extension:
3%.
This gives leadership a view of renewal behavior.
Why Outcome Mix Matters
If:
98% = Renew As-Is
the organization may not be challenging suppliers enough.
But if:
60% = Terminate
there may be another problem.
The metric is diagnostic, not a target by itself.
KPI 25: Renewal Forecast Confidence
Measure what proportion of forecasted spend is:
High Confidence
Medium Confidence
Low Confidence
For example:
High:
€18M.
Medium:
€8M.
Low:
€4M.
This helps executives understand uncertainty.
KPI 26: Policy Compliance
Organizations may define renewal policies such as:
All contracts above €500K must enter review 180 days before notice deadline.
Measure compliance.
For example:
Eligible:
Compliant:
Policy Compliance:
89.6%
This supports governance.
Policy Breach Value
Again, show value.
Breaches:
Associated value:
€8.2M.
This is more meaningful.
KPI 27: Exception Rate
Measure how many renewals require:
- workflow exceptions;
- approval exceptions;
- policy exceptions.
A rising rate may indicate the policy is unrealistic or teams are bypassing process.
KPI 28: Emergency Extension Rate
A particularly telling metric:
How often do we need short emergency extensions because renewal preparation started too late?
For example:
4%.
Target:
<1%.
This is an excellent maturity indicator.
Emergency Extension Cost
The organization can also record:
- premium pricing;
- legal cost;
- operational effort.
This makes the consequences measurable.
KPI 29: Renewal Escalation Rate
Measure:
Percentage of renewals requiring management escalation.
This can reveal process friction.
For example:
18%.
If the target is 5%, ownership or workflow may need improvement.
KPI 30: Escalation Resolution Time
How quickly are critical escalations resolved?
For example:
Average:
4.8 days.
This tells management whether the escalation model actually works.
Dashboard Design by Persona
The same metrics should not be shown identically to everyone.
Each role needs a focused dashboard.
CFO Dashboard
A CFO likely cares most about:
Renewal Spend Next 12 Months
€42M.
Expected Commitment
€43.1M.
Budget Variance
+€1.1M.
Undecided Exposure
€4.2M.
Finance-Validated Savings
€1.6M.
Multi-Year Commitments Pending
€12M.
Critical Financial Renewals
This is a financial-control dashboard.
Procurement Dashboard
Procurement may see:
Addressable Renewal Spend
€28M.
Active Negotiations
€14M.
Savings Pipeline
€2.8M.
Finance-Validated Savings
€1.4M.
Supplier Increases >10%
Strategic Renewals Behind Schedule
Consolidation Opportunities
This is a commercial dashboard.
Legal Dashboard
Legal may see:
Notice Deadlines <30 Days
Legal Reviews Open
Critical Reviews
Conflicting Renewal Terms
Termination Notices Pending
Average Review Time
6.2 days.
SLA Compliance
93%.
This is a legal-operations dashboard.
Business Owner Dashboard
Business owners should receive something much simpler:
My Renewals
Action Required
Overdue
Annual Spend Under Review
€420K.
They do not need the enterprise KPI stack.
Vendor Management Dashboard
Vendor managers may care about:
- strategic supplier renewals;
- performance scores;
- open issues;
- SLA breaches;
- dependency.
For example:
Strategic Suppliers Renewing:
Below Performance Threshold:
High-Dependency Renewals:
Executive Dashboard
The executive dashboard should be exception-based.
For example:
Enterprise Renewal Scorecard
Renewing Next 180 Days: €84M
Undecided: €7.2M
High/Critical Risk: €12.4M
Auto-Renewal Exposure <90 Days: €3.1M
Savings YTD: €4.6M
Budget Variance Forecast: +€1.2M
Critical Decisions Required: 7
That may be sufficient.
Add Trends, Not Just Snapshots
Executives need to know whether things are improving.
For example:
High/Critical Risk:
Last Month:
€18M.
Current:
€12.4M.
Trend:
Improving 31%
This provides context.
Trend Dashboard
Possible trend lines include:
- undecided spend;
- high-risk exposure;
- savings;
- deadline compliance;
- cycle time;
- forecast accuracy.
This helps leadership monitor maturity.
Portfolio Health Score
Contract Renewal Tracker could eventually create an overall:
Renewal Portfolio Health Score
For example:
82/100 — Good
Based on:
- decision coverage;
- risk;
- data quality;
- workflow timing;
- compliance.
This can provide a simple executive summary.
Health Score Breakdown
For example:
Decision Readiness:
Deadline Compliance:
Data Quality:
Risk Exposure:
Workflow Timeliness:
Overall:
83
The breakdown is more important than the single score.
Avoid Over-Simplifying Complex Metrics
A health score should never hide serious issues.
For example:
Overall:
But:
One €20M contract is Critical.
That contract still deserves executive attention.
The dashboard should combine:
portfolio score
with:
critical exceptions.
Executive Exception List
For example:
Immediate Decisions
1. Global Cloud Contract
€8.2M
Notice deadline:
18 days.
Issue:
Negotiation unresolved.
2. Outsourcing Agreement
€5.4M.
Issue:
Finance approval overdue.
This ensures management focuses on what matters.
Dashboard Filters
Useful filters include:
- region;
- department;
- supplier;
- contract category;
- owner;
- risk;
- legal entity.
The same dashboard can support several management views.
Drill-Down Design
The executive sees:
€12.4M High/Critical Risk
Clicks.
↓
Suppliers.
↓
Contracts.
↓
Workflow.
↓
Specific blocker.
This connects strategy to operational detail.
Scheduled Management Briefs
Not every executive will log into the platform daily.
Contract Renewal Tracker could generate:
Weekly
Critical renewal briefing.
Monthly
Portfolio performance report.
Quarterly
Executive renewal review.
This makes the metrics part of management routines.
Weekly Renewal Brief
For example:
This Week
New Critical Renewals:
Risk Resolved:
Decisions Required:
Value Requiring Executive Action:
€4.8M.
Savings Contracted:
€210K.
This is concise and actionable.
Monthly Portfolio Report
Could include:
- renewal value;
- risk;
- savings;
- workflow performance;
- data quality;
- forecast.
This creates a standard operating report.
Quarterly Business Review
At quarter end, leadership might review:
What renewed?
What value was created?
What problems occurred?
What is coming next quarter?
This turns contract renewal management into a recurring business discipline.
AI Executive Dashboard Assistant
Executives could ask:
What should I care about this week?
The AI assistant could summarize:
Three renewal issues require executive attention. A €4.2M cloud agreement is 21 days from notice deadline with negotiation unresolved, a €1.8M outsourcing renewal is blocked by finance approval, and €620K of auto-renewing software remains undecided inside 30 days.
This is much more useful than manually reviewing dashboards.
Ask AI: Why Did Risk Increase?
The assistant could answer:
High/Critical renewal value increased by €2.1M this week because two strategic supplier contracts entered the final 60-day window without approved renewal strategies.
This makes metrics explainable.
Ask AI: Why Are Savings Below Target?
For example:
Savings are €480K below target primarily because two planned supplier consolidations moved into next quarter and three SaaS optimization initiatives realized less license reduction than forecast.
This gives management the reason behind the KPI.
Ask AI: Where Is the Bottleneck?
Response might be:
Finance approvals currently account for 41% of overdue high-value renewals. Average approval time has increased from 3.2 to 6.8 days.
That is highly actionable.
AI Should Support, Not Replace, the Metrics
The executive narrative should be generated from:
measured data
not subjective interpretation alone.
Users should be able to drill into the underlying records.
KPI Alerts
Dashboards are useful.
Alerts are even better for threshold breaches.
For example:
Undecided renewal value inside 30 days exceeded €5M.
Or:
Notice-deadline compliance fell below 98%.
Or:
High-risk renewal exposure increased 25% week over week.
These can trigger management attention automatically.
Management Thresholds
Organizations can define:
Risk Exposure Maximum
Undecided Spend Maximum
Approval SLA
Deadline Compliance Minimum
Savings Target
The system monitors them.
Example KPI Guardrail
IF notice_deadline_compliance < 99%THEN alert_contract_operations_lead
Another:
IF undecided_value_30d > €2,000,000THEN alert_procurement_and_cfo
This creates active management.
KPIs by Organization Size
Not every company needs all 30 metrics.
Small Business
Focus on:
- upcoming renewals;
- auto-renewals;
- decisions required;
- avoided spend.
Mid-Market
Add:
- workflow;
- savings;
- approvals;
- risk.
Enterprise
Add:
- regional performance;
- policy compliance;
- forecast accuracy;
- capacity;
- portfolio health.
The dashboard should mature with the organization.
Do Not Measure What You Will Not Act On
A useful dashboard design rule is:
Every KPI should support a decision or action.
If nobody will ever change behavior based on a metric, it probably does not belong on the main dashboard.
This keeps reporting focused.
Start with Outcomes
The highest-value metrics are usually:
Missed Deadlines
Financial Value Created
Risk Exposure
Decision Readiness
Then add process metrics that explain why those outcomes occurred.
Leading and Lagging KPIs
A mature scorecard should contain both.
Lagging
- missed renewals;
- savings realized;
- contracts terminated.
Leading
- workflow start rate;
- overdue decisions;
- approval delays;
- high-risk exposure.
The leading indicators help prevent bad outcomes.
KPI Hierarchy
A useful hierarchy is:
Executive Outcome
Did we create value and control risk?
↓
Process
Did the workflow operate correctly?
↓
Operational Driver
Where is the process failing?
For example:
Missed Deadline
↓
Late Workflow
↓
Business Owner Response Delay
This creates diagnostic reporting.
Renewal Operations Maturity Score
A future product could score organizations across:
Visibility
Do we know the portfolio?
Ownership
Are responsibilities clear?
Timing
Do workflows start early?
Governance
Are approvals controlled?
Optimization
Are savings tracked?
Intelligence
Are risk and forecasts used?
This could help customers benchmark their own maturity over time.
Example Maturity Levels
Level 1 — Reactive
Spreadsheets and reminders.
Level 2 — Controlled
Central register and deadlines.
Level 3 — Automated
Workflows and escalations.
Level 4 — Optimized
Savings, supplier intelligence, forecasting.
Level 5 — Predictive
AI, risk prediction, next-best action.
This also provides a useful product-adoption roadmap.
Benchmarking Over Time
Even without industry benchmarks, an organization can compare against itself.
For example:
2027
Missed Deadline Rate:
2.1%.
2028
0.8%.
2029
0.1%.
That clearly demonstrates improvement.
Renewal ROI Dashboard
The system should also show its own economic impact.
For example:
Annual Platform Cost
€18K.
Avoided Renewals
€220K.
Hard Savings
€380K.
Cost Avoidance
€560K.
Productivity Value
€42K.
Finance-Validated Financial Value
€1.16M.
This is particularly valuable before the Contract Renewal Tracker subscription itself renews.
Value-to-Cost Ratio
Formula:
Validated Financial Value ÷ Platform Cost
For example:
€1.16M ÷ €18K
=
64.4×
This provides a straightforward SaaS business case.
Again, only defensible measured outcomes should be included.
ROI Should Remain Conservative
Avoid claiming:
Every retained euro happened because of the platform.
Instead report:
Value Tracked Through Contract Renewal Tracker
This is more credible.
Contract Renewal Tracker as a Management System
This is the strategic product evolution.
The platform begins as:
Contract Tracking
Then becomes:
Workflow Management
Then:
Risk Management
Then:
Forecasting
Finally:
Performance Management
The KPI layer connects all of these capabilities.
From Reminder Tool to Operating System
The progression becomes:
Dates
↓
Workflows
↓
Decisions
↓
Financial Outcomes
↓
Risk
↓
Forecasts
↓
KPIs
↓
Management Action
At that point, Contract Renewal Tracker is no longer merely a contract reminder application.
It becomes a renewal operations management system.
Ready to Make Contract Renewals Measurable?
Organizations cannot improve a renewal process they cannot see.
Contract Renewal Tracker is designed to give finance, procurement, legal, business owners, and executives a common set of renewal metrics without forcing every user to consume the same dashboard.
Use Contract Renewal Tracker to:
- measure upcoming renewal value;
- track undecided spend;
- monitor notice-deadline compliance;
- quantify auto-renewal exposure;
- measure high-risk contract value;
- track workflow start rates;
- monitor owner responsiveness;
- measure procurement savings;
- validate cost avoidance;
- track approval delays;
- measure legal review performance;
- monitor data quality;
- assess forecast accuracy;
- report supplier performance;
- track policy compliance;
- generate executive renewal scorecards;
- use AI to explain KPI movements and identify bottlenecks.
The objective is to move from:
“We think our renewals are under control.”
to:
“We can prove where renewal performance is strong, where risk is growing, and what needs management attention.”
Start Your Contract Renewal Tracker Subscription →
Final Thoughts
Good renewal management is not measured by how many reminders were sent.
It is measured by outcomes.
Did the organization:
act before the deadline?
make an explicit decision?
protect commercial leverage?
avoid unnecessary spend?
complete approvals on time?
reduce risk?
forecast future commitments accurately?
Those outcomes can then be traced back to operational drivers such as:
- ownership;
- workflow timing;
- legal review;
- procurement engagement;
- data quality.
That creates a complete management loop:
Measure
↓
Understand
↓
Prioritize
↓
Intervene
↓
Improve
For Contract Renewal Tracker, the KPI and executive-dashboard layer is therefore more than reporting.
It is the mechanism that turns contract renewal management into a repeatable, measurable business discipline.
Next Article in the Contract Renewal Tracker Series
Article 49 — “Contract Renewal Alerts and Escalation Management: How to Design Notifications That Drive Action Without Creating Alert Fatigue”
The next article will focus on one of the most practical SaaS product capabilities: notification design. It will cover reminder cadences, severity levels, email versus Teams/Slack/in-app delivery, owner escalation, manager escalation, digesting low-priority alerts, deduplication, quiet hours, timezone awareness, notification preferences, action-oriented messages, delivery failures, acknowledgment tracking, SLA-based escalation, and AI-generated alert summaries.
This will help position Contract Renewal Tracker not merely as software that sends reminders, but as a system that gets the right renewal information to the right person at the right time and keeps escalating until the required action actually happens.

