Contract renewal management is often introduced as a defensive discipline.
Avoid missing deadlines.
Prevent unwanted auto-renewals.
Make sure notice periods are tracked.
Ensure approvals happen on time.
Those capabilities are important, but they represent only part of the opportunity.
Every renewal is also a commercial decision point.
It is a moment when an organization can ask:
- Are we still using what we are paying for?
- Are we paying a competitive price?
- Do we need the same quantity next year?
- Are multiple contracts providing overlapping capabilities?
- Can suppliers be consolidated?
- Is the proposed price increase justified?
- Would a different contract term improve pricing?
- Should this contract exist at all?
A Contract Renewal Tracker can therefore evolve from a deadline-management system into a cost optimization platform.
Instead of merely asking:
Which contracts are renewing?
the organization can ask:
Where can we reduce spend before the next renewal becomes committed?
That shift can turn contract renewal management from an administrative cost center into a measurable source of financial value.
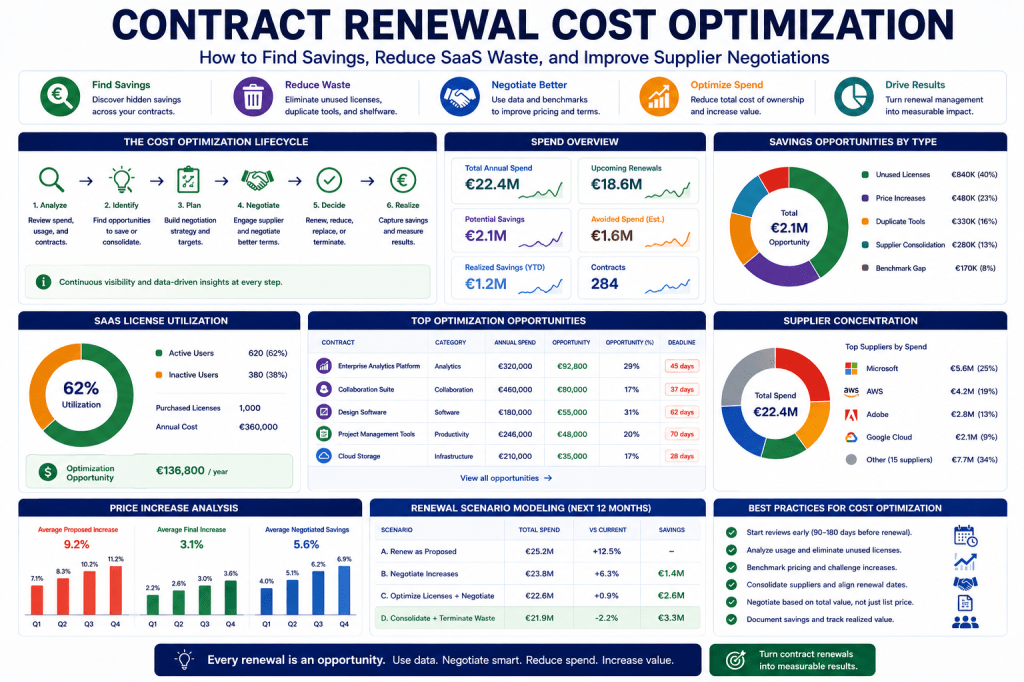
Why Renewals Are Ideal Cost Optimization Events
Once a contract has renewed, negotiating leverage can decrease substantially.
Before renewal, the organization may still have several options:
Renew
Renegotiate
Reduce
Replace
Consolidate
Terminate
Once the renewal deadline passes, some of those options may disappear.
This makes the period before renewal one of the most valuable moments for reviewing spend.
The Contract Renewal Tracker should therefore treat every material renewal as a potential optimization event.
The Cost Optimization Lifecycle
A renewal optimization process might look like:
Upcoming Renewal
↓
Spend Analysis
↓
Usage Analysis
↓
Supplier Performance
↓
Market Benchmarking
↓
Optimization Opportunities
↓
Negotiation Strategy
↓
Renewal Decision
↓
Negotiation
↓
Savings Captured
↓
Outcome Measured
This connects contract management directly to financial performance.
Start with the Current Contract Cost
The first requirement is understanding what the organization actually spends.
For each contract, useful fields include:
- annual contract value;
- monthly recurring cost;
- one-time fees;
- support fees;
- implementation fees;
- usage charges;
- overage charges;
- taxes where relevant;
- committed minimum spend.
For example:
Enterprise Analytics Platform
Subscription:
€240,000
Premium support:
€36,000
Usage overages:
€28,000
Additional services:
€16,000
Actual Annual Spend
€320,000
Looking only at the base subscription would understate the true commercial exposure.
Contracted Value vs Actual Spend
These are different metrics.
Suppose a cloud contract includes:
Committed Spend: €500,000
Actual consumption:
€640,000
The organization is spending €140,000 above the contractual commitment.
That may indicate:
- rapid growth;
- poor resource optimization;
- inappropriate pricing structure;
- opportunity for a higher commitment discount.
Alternatively:
Committed spend:
€500,000
Actual consumption:
€320,000
Now the organization may be overcommitted.
Both scenarios create different renewal strategies.
SaaS License Utilization
One of the clearest optimization opportunities exists in SaaS contracts.
Suppose:
Purchased licenses:
1,000
Monthly active users:
620
Annual cost:
€360,000
Cost per license:
€360/year
Unused licenses:
380
Potential unused-license spend:
€136,800/year
That does not necessarily mean all 380 licenses should be removed.
Some may be:
- seasonal users;
- occasional users;
- new employees;
- backup accounts;
- required administrators.
But it creates a strong reason to investigate before renewal.
License Utilization Rate
A useful metric is:
License Utilization Rate = Active Licenses ÷ Purchased Licenses × 100
For the previous example:
620 ÷ 1,000 × 100
=
62% utilization
The Contract Renewal Tracker could classify:
90–100%
High utilization.
75–89%
Normal review.
50–74%
Optimization opportunity.
Below 50%
Major optimization opportunity.
Thresholds should be configurable.
Different Definitions of “Active”
Usage analysis needs context.
A user who logged in once during the last year should not necessarily count as actively using the software.
Organizations may define:
Daily Active User
Weekly Active User
Monthly Active User
90-Day Active User
For contract optimization, a useful metric might be:
Users who performed meaningful activity during the previous 90 days.
The appropriate definition depends on the product.
Detecting Shelfware
Unused or underused software is often described as shelfware.
Examples include:
- licenses assigned but never used;
- premium features rarely used;
- duplicate software tools;
- abandoned pilot subscriptions;
- accounts belonging to former employees;
- unused add-ons.
The Contract Renewal Tracker could flag:
37% of licenses have recorded no activity during the previous 90 days.
That becomes a renewal action:
Review license quantities before negotiation.
Former Employee Licenses
Another common source of waste is accounts belonging to employees who have left the organization.
Suppose:
Purchased licenses:
850
Accounts associated with inactive employees:
73
Cost per license:
€420/year
Potential annual waste:
€30,660
Connecting renewal data with identity or HR systems can reveal these opportunities automatically.
License Tier Optimization
Organizations may also pay for premium licenses when standard tiers would be sufficient.
For example:
Premium licenses:
400
Users actually using premium features:
115
Potential action:
Move 285 users to standard tier.
This can create significant savings without reducing access to essential functionality.
Feature Utilization
Cost optimization becomes more sophisticated when the system can understand feature usage.
Suppose a premium SaaS platform includes:
- analytics;
- automation;
- AI features;
- advanced reporting;
- API access.
But the organization mainly uses basic functionality.
The renewal tracker could surface:
Premium features are used by only 14% of licensed users.
Possible recommendation:
Evaluate lower-cost licensing tier before renewal.
Duplicate Software Detection
Organizations often accumulate overlapping tools.
For example:
Marketing uses one project-management platform.
IT uses another.
Operations uses a third.
A fourth platform was acquired through an acquisition.
All four renew separately.
A Contract Renewal Tracker can group contracts by category.
For example:
Project Management Software
Supplier A:
€95,000
Supplier B:
€72,000
Supplier C:
€48,000
Supplier D:
€31,000
Combined annual spend:
€246,000
This creates a consolidation opportunity.
Functional Overlap
Duplicate detection should not depend only on product names.
Different products may provide similar capabilities.
The tracker could classify contracts using categories such as:
- CRM;
- project management;
- file storage;
- cybersecurity;
- analytics;
- communications;
- collaboration;
- design;
- marketing automation;
- HR technology.
AI can help identify functional overlap between contracts.
Supplier Consolidation
Multiple contracts with the same supplier may also create an opportunity.
Suppose an organization has:
Cloud infrastructure:
€800,000
Data platform:
€220,000
Security services:
€160,000
Support:
€120,000
Total supplier relationship:
€1.3 million
If each contract is negotiated independently, the organization may fail to use its full purchasing leverage.
The Contract Renewal Tracker can flag:
Four contracts with the same supplier renew within the next six months.
Possible action:
Consolidate negotiations.
Renewal Clustering Creates Negotiation Leverage
Imagine three contracts with one supplier renew:
March:
€180,000
May:
€240,000
June:
€310,000
Combined:
€730,000
Rather than negotiating three independent renewals, procurement may ask the supplier to discuss the entire relationship.
Potential benefits include:
- volume discounts;
- better payment terms;
- improved service levels;
- reduced price increases;
- standardized renewal dates;
- improved termination rights.
The Contract Renewal Tracker can detect these clusters automatically.
Co-Termination
An organization may deliberately align contract renewal dates.
This is sometimes called co-termination.
Instead of:
Contract A → March
Contract B → July
Contract C → November
the organization negotiates:
All contracts → December
This can simplify:
- supplier management;
- budgeting;
- negotiation;
- renewal governance.
It also improves visibility of the total supplier relationship.
Price Increase Detection
A renewal tracker should compare proposed renewal pricing with current pricing.
For example:
Current annual cost:
€280,000
Supplier proposal:
€310,800
Increase:
11%
The system can flag:
Proposed price increase exceeds the organization’s 5% review threshold.
Procurement can then investigate.
Price Increase Should Be Calculated Automatically
A simple calculation is:
Price Increase % = (New Price − Current Price) ÷ Current Price × 100
Example:
Current price:
€280,000
New price:
€310,800
Difference:
€30,800
Percentage increase:
11%
The tracker can calculate this whenever a renewal proposal is entered.
Separate Price Increase from Scope Increase
A higher renewal price does not always mean the supplier raised prices.
Suppose:
Previous licenses:
500
New licenses:
650
The total contract value naturally increases.
The system should distinguish:
Unit Price Change
from:
Quantity Change
For example:
Previous unit price:
€500.
New unit price:
€520.
Actual unit price increase:
4%
This provides a more accurate commercial analysis.
Unit Economics
For many contracts, useful unit metrics include:
- cost per license;
- cost per employee;
- cost per transaction;
- cost per GB;
- cost per API call;
- cost per location;
- cost per device;
- cost per customer.
These metrics make supplier proposals easier to compare.
Historical Pricing
The tracker should preserve previous renewal pricing.
For example:
| Year | Annual Cost | Increase |
|---|---|---|
| 2025 | €200K | — |
| 2026 | €210K | 5% |
| 2027 | €225K | 7.1% |
| 2028 | €247K | 9.8% |
The system can detect a pattern:
Supplier price increases have accelerated during the last three renewal cycles.
That gives procurement stronger evidence for negotiation.
Cumulative Price Growth
Annual increases can appear small individually but become significant over time.
Suppose a supplier increases pricing 7% every year.
Starting price:
€200,000
After one increase:
€214,000
After another:
approximately €229,000
After another:
approximately €245,000
Over several years, the effect becomes substantial.
The renewal tracker can display cumulative price growth rather than only the latest increase.
Benchmark Pricing
Another optimization capability is comparing pricing with benchmarks.
Possible benchmark sources include:
- previous supplier proposals;
- similar internal contracts;
- market research;
- procurement databases;
- peer data;
- alternative supplier quotations.
For example:
Current cost per user:
€620/year
Internal benchmark:
€540/year
Difference:
€80/user
Licenses:
1,200
Potential annual opportunity:
€96,000
The benchmark does not guarantee that the lower price is achievable, but it creates a negotiation target.
Internal Benchmarking
Organizations with many similar contracts can build their own pricing intelligence.
For example:
Business Unit A pays:
€480/user.
Business Unit B pays:
€550/user.
Business Unit C pays:
€610/user.
Same supplier.
Same product tier.
The Contract Renewal Tracker can flag inconsistent pricing.
This is especially valuable in decentralized organizations.
Negotiation Target
Before contacting the supplier, procurement should define a target.
For example:
Current annual cost:
€420,000
Supplier proposal:
€455,000
Internal benchmark:
€390,000
Negotiation target:
€400,000
Walk-away threshold:
€425,000
The renewal tracker can store these values.
This turns negotiation into a measurable process.
Negotiation Opportunity Score
Similar to renewal risk scoring, the system can calculate an Optimization Opportunity Score.
Possible factors include:
- contract value;
- unused licenses;
- price increase;
- duplicate functionality;
- supplier consolidation potential;
- benchmark gap;
- poor supplier performance;
- upcoming renewal deadline.
For example:
Opportunity Score: 88/100
Reasons:
- annual value €850K;
- utilization 61%;
- proposed increase 9%;
- similar internal contract priced 12% lower;
- two overlapping tools exist.
This tells procurement where savings efforts may produce the greatest return.
Risk Score vs Opportunity Score
These scores answer different questions.
Renewal Risk Score
Where could something go wrong?
Optimization Opportunity Score
Where could we create financial value?
A contract could therefore have:
Risk Score: 42 — Medium
Opportunity Score: 91 — Very High
That contract deserves attention even though it is not currently dangerous.
Combining Risk and Opportunity
The Contract Renewal Tracker can create a prioritization matrix.
| Low Opportunity | High Opportunity | |
|---|---|---|
| Low Risk | Monitor | Optimize |
| High Risk | Protect | Immediate Priority |
The most important contracts are:
High Risk + High Opportunity
because they simultaneously represent potential loss and potential savings.
Example: High Risk + High Opportunity
Contract:
Enterprise Collaboration Platform
Annual value:
€720,000
Notice deadline:
37 days
Auto-renewal:
24 months
Utilization:
64%
Supplier price increase:
10%
Duplicate platform:
Yes
Risk Score:
79 — Very High
Opportunity Score:
92 — Very High
Recommended action:
Begin immediate negotiation, reduce license quantities, evaluate consolidation, and prepare non-renewal notice as a contingency.
This is a high-value procurement event.
Supplier Performance and Pricing
Price should not be considered independently of performance.
Suppose:
Supplier proposes:
8% price increase
but:
- SLA performance declined;
- support response times increased;
- outages increased;
- user satisfaction decreased.
The Contract Renewal Tracker could flag:
Supplier performance deteriorated while proposed pricing increased 8%.
That strengthens the negotiation case.
Cost per Performance
Advanced analysis can combine financial and operational metrics.
For example:
Annual cost:
€600,000.
SLA achievement:
99.5%.
Previous year:
€540,000.
SLA achievement:
99.9%.
The organization is paying more while receiving worse service.
That is useful renewal intelligence.
Multi-Year Discounts
Suppliers frequently offer discounts for longer commitments.
For example:
1-Year Renewal
€500,000/year.
3-Year Renewal
€450,000/year.
Apparent savings:
€50,000/year.
Three-year nominal savings:
€150,000.
But the organization also accepts:
€1.35 million committed spend
and reduced flexibility.
The Contract Renewal Tracker should evaluate both savings and lock-in risk.
Discount vs Flexibility
A 10% discount may appear attractive.
But questions include:
- Could usage decline?
- Is the technology changing quickly?
- Is the supplier strategically important?
- Are alternatives emerging?
- Is termination allowed?
- Is the price fixed for the entire term?
The cheapest nominal price is not always the best commercial outcome.
Total Cost of Ownership
Renewal analysis should consider more than subscription price.
Possible costs include:
- implementation;
- migration;
- integration;
- training;
- support;
- internal administration;
- switching costs;
- termination fees.
Suppose:
Current supplier:
€500K/year.
Alternative supplier:
€420K/year.
Potential annual savings:
€80K.
But migration cost:
€300K.
The business case changes.
The tracker can calculate a multi-year TCO comparison.
Example Three-Year TCO
Current Supplier
Subscription:
€500K × 3
Total:
€1.5M
Alternative Supplier
Subscription:
€420K × 3 = €1.26M
Migration:
€300K
Total:
€1.56M
The cheaper annual subscription is actually more expensive over three years.
This is why renewal optimization needs context.
Avoided Spend
Savings are not limited to negotiated discounts.
If the organization terminates an unnecessary contract, it avoids future spend.
For example:
Annual contract:
€180,000
Decision:
Terminate
Avoided annual spend:
€180,000
If the contract would have automatically renewed for two years:
Potential avoided commitment:
€360,000
This should be tracked separately from negotiated savings.
Hard Savings vs Cost Avoidance
Procurement organizations often distinguish:
Hard Savings
Reduction against existing spend.
Example:
Previous cost:
€500K.
New cost:
€450K.
Hard savings:
€50K
Cost Avoidance
Reduction against a proposed future cost.
Example:
Supplier proposal:
€550K.
Negotiated price:
€500K.
Cost avoidance:
€50K
These metrics should not necessarily be combined.
The Contract Renewal Tracker can report them separately.
Savings Validation
Claimed savings should be verifiable.
The system should store:
- baseline;
- supplier proposal;
- final price;
- quantity changes;
- scope changes;
- calculation method;
- approval.
This prevents inflated savings claims.
Renewal Savings Record
For example:
Contract
Cybersecurity Platform
Previous Annual Cost
€320,000
Supplier Renewal Proposal
€355,000
Final Negotiated Cost
€300,000
Hard Savings
€20,000
Cost Avoidance
€35,000
Total Commercial Improvement vs Proposal
€55,000
This provides transparent reporting.
Savings Dashboard
A Contract Renewal Tracker could show:
Year-to-Date Renewal Optimization
Contracts optimized:
86
Hard savings:
€1.2M
Cost avoidance:
€870K
Avoided spend:
€1.6M
Supplier consolidation savings:
€420K
Total identified opportunity:
€6.8M
Remaining opportunity:
€2.7M
This demonstrates the business value of renewal management.
Savings Pipeline
Not every opportunity has been realized yet.
The tracker can manage an optimization pipeline.
Identified
€4.2M opportunity.
Under Review
€2.8M.
Negotiating
€1.9M.
Agreed
€1.1M.
Realized
€870K.
This makes cost optimization measurable like a sales pipeline.
AI-Assisted Cost Optimization
AI can analyze contract, usage, pricing, and supplier data to generate recommendations.
For example:
AI Optimization Analysis
Contract: Enterprise Design Platform
Annual spend:
€460,000
Utilization:
58%
Proposed price increase:
7%
Unused licenses:
340
Internal benchmark gap:
9%
Renewal deadline:
94 days
Recommendations
- Reduce license count before renewal.
- Challenge proposed 7% increase.
- Request volume pricing based on revised quantity.
- Evaluate lower-cost license tier for occasional users.
- Compare pricing with existing internal benchmark.
Estimated optimization opportunity:
€80K–€130K annually
Such estimates should be treated as decision support rather than guaranteed savings.
AI Can Detect Patterns Across Contracts
A single contract may not reveal much.
Portfolio analysis can.
For example:
14 contracts from the same supplier contain annual price increases above 8%.
or:
Six departments purchase overlapping project-management tools with combined spend of €640K.
or:
23 SaaS contracts have utilization below 60%.
These patterns create portfolio-level optimization opportunities.
Renewal Cost Forecasting
The tracker can forecast future contract spend.
For example:
Current annual contract spend:
€22.4M
Known renewals:
€18.6M
Expected contractual increases:
€1.3M
Expected new annual spend:
€23.7M
Potential optimization opportunities:
€2.1M
Target optimized spend:
€21.6M
This makes renewal management useful for budgeting.
Scenario Planning
Management could compare scenarios.
Scenario A — Renew Everything as Proposed
Next-year spend:
€25.2M
Scenario B — Negotiate Price Increases
Spend:
€23.8M
Scenario C — Optimize Licenses + Negotiate
Spend:
€22.6M
Scenario D — Consolidate + Terminate Low-Value Contracts
Spend:
€21.9M
This turns the Contract Renewal Tracker into a financial planning tool.
Optimization Rules
Organizations can configure automatic rules.
For example:
Rule: Low Utilization
IF:
Utilization < 70%
THEN:
Create license optimization task.
Rule: High Price Increase
IF:
Renewal increase > 5%
THEN:
Require procurement review.
Rule: Duplicate Category
IF:
More than two active contracts exist in same software category
THEN:
Flag consolidation review.
Rule: High Supplier Concentration
IF:
Supplier spend > €1M
AND multiple contracts renew within 180 days
THEN:
Recommend consolidated negotiation.
Rule: High Benchmark Gap
IF:
Unit price > benchmark by 10%
THEN:
Create negotiation opportunity.
These rules automate opportunity discovery.
Procurement Work Queue
The tracker can prioritize commercial opportunities.
For example:
Highest Optimization Opportunities
Cloud Infrastructure
Potential opportunity:
€280K
Deadline:
82 days
Collaboration Platform
Potential opportunity:
€160K
Deadline:
47 days
Analytics Software
Potential opportunity:
€95K
Deadline:
110 days
Security Platform
Potential opportunity:
€75K
Deadline:
33 days
Procurement can focus resources where they are likely to produce the greatest return.
Cost Optimization Should Start Early
Commercial optimization requires time.
If procurement begins negotiating five days before the deadline, the supplier knows the customer’s options are limited.
Starting 120 or 180 days earlier creates room for:
- benchmarking;
- competitive quotations;
- usage analysis;
- internal discussions;
- alternative supplier evaluation;
- negotiation.
Time is one of the most valuable sources of leverage in renewal negotiations.
The Contract Renewal Tracker as a Negotiation Intelligence Platform
Once the system stores renewal history, it can provide valuable negotiation context.
For example:
Supplier History
2026:
Supplier proposed +8%.
Final outcome:
+3%.
2027:
Supplier proposed +10%.
Final outcome:
+2%.
2028:
Supplier proposes +11%.
The procurement team now knows that previous increases were negotiable.
Supplier Negotiation Performance
The tracker can also measure supplier behavior.
For example:
Average initial increase:
9.2%
Average final increase:
3.1%
Average negotiation duration:
24 days
Average discount from initial proposal:
5.6%
This helps procurement prepare future strategies.
Negotiator Performance
Organizations may also analyze internal performance carefully.
For example:
Average savings by contract category.
Average cycle time.
Percentage of renewals benchmarked.
Percentage of renewals competitively sourced.
The objective should be process improvement rather than simplistic ranking of employees.
Renewal Optimization KPIs
Useful metrics include:
Savings Realized
Actual reduction against previous spend.
Cost Avoidance
Reduction against proposed increases.
Avoided Spend
Future spend eliminated through termination.
License Utilization
Percentage of purchased licenses actively used.
Price Increase Rate
Average proposed and final increases.
Optimization Coverage
Percentage of material renewals receiving commercial review.
Supplier Consolidation
Number of contracts consolidated.
Savings per Renewal
Average financial improvement.
These metrics connect renewal management to measurable business outcomes.
Cost Optimization Dashboard
A mature dashboard could show:
Upcoming Renewal Spend
Next 30 days:
€1.8M
Next 90 days:
€5.4M
Next 180 days:
€11.7M
Optimization Opportunity
Low utilization:
€840K
Price increases:
€1.2M
Duplicate tools:
€620K
Supplier consolidation:
€910K
Benchmark gaps:
€480K
Realized Value
Hard savings:
€1.4M
Cost avoidance:
€960K
Avoided spend:
€1.8M
Total documented financial impact:
€4.16M
At this stage, the Contract Renewal Tracker has moved far beyond calendar reminders.
From Defensive Management to Value Creation
The evolution can be represented as:
Stage 1 — Visibility
Know which contracts exist.
↓
Stage 2 — Deadline Control
Know when renewals occur.
↓
Stage 3 — Workflow
Manage renewal decisions.
↓
Stage 4 — Risk Management
Prioritize dangerous renewals.
↓
Stage 5 — Cost Optimization
Find savings opportunities.
↓
Stage 6 — Renewal Intelligence
Predict where intervention creates the greatest value.
This is the broader opportunity behind a Contract Renewal Tracker.
Final Thoughts
The best contract renewal is not simply one that happens on time.
It is one where the organization deliberately determines:
what it needs, how much it needs, what it should pay, which terms it should accept, and whether the contract should continue at all.
That makes renewal a natural cost-control checkpoint.
A strong Contract Renewal Tracker can combine:
Contract Data + Spend + Usage + Supplier Performance + Pricing + Benchmarks + Deadlines + Risk
to generate:
Optimization Opportunities → Negotiation Strategy → Decisions → Savings
Instead of merely preventing unwanted renewals, the system begins identifying unwanted spend.
Instead of simply warning that a supplier contract is approaching renewal, it can say:
You are paying for 1,000 licenses, but only 620 are actively used.
or:
This supplier is proposing an 11% increase while service performance has declined.
or:
Four overlapping software contracts worth €430,000 renew during the next six months.
Those are no longer reminders.
They are commercial intelligence.
And that is where a Contract Renewal Tracker can begin generating measurable financial returns for the organizations using it.
Next Article in the Contract Renewal Tracker Series
Article 13 — “Contract Renewal Analytics Dashboard: The KPIs, Metrics, Charts, and Executive Insights You Should Track”
The next article will bring the data from the previous parts together into the management dashboard. It will cover renewal value by month, upcoming notice exposure, auto-renewal exposure, risk distribution, workflow status, approval bottlenecks, supplier concentration, savings, avoided spend, renewal cycle time, decision outcomes, forecasted spend, executive KPIs, drill-down views, and AI-generated portfolio insights.

