A contract renewal system becomes significantly more valuable when it can answer questions about the entire contract portfolio rather than one agreement at a time.
How much contract value renews during the next 90 days?
How much spend is exposed to automatic renewal?
Which renewals are currently critical?
Which departments have the largest upcoming commitments?
Where are approval workflows becoming bottlenecks?
How much money has been saved through renegotiation?
Which suppliers represent the greatest concentration of spend?
How much contract value will become committed if the organization takes no action during the next 30 days?
These are no longer contract-record questions.
They are management questions.
A Contract Renewal Analytics Dashboard transforms the operational data inside a Contract Renewal Tracker into portfolio intelligence for procurement, finance, legal, contract managers, business owners, and executives.
The objective is not to fill the screen with charts.
It is to make the most important renewal decisions visible before they become urgent.
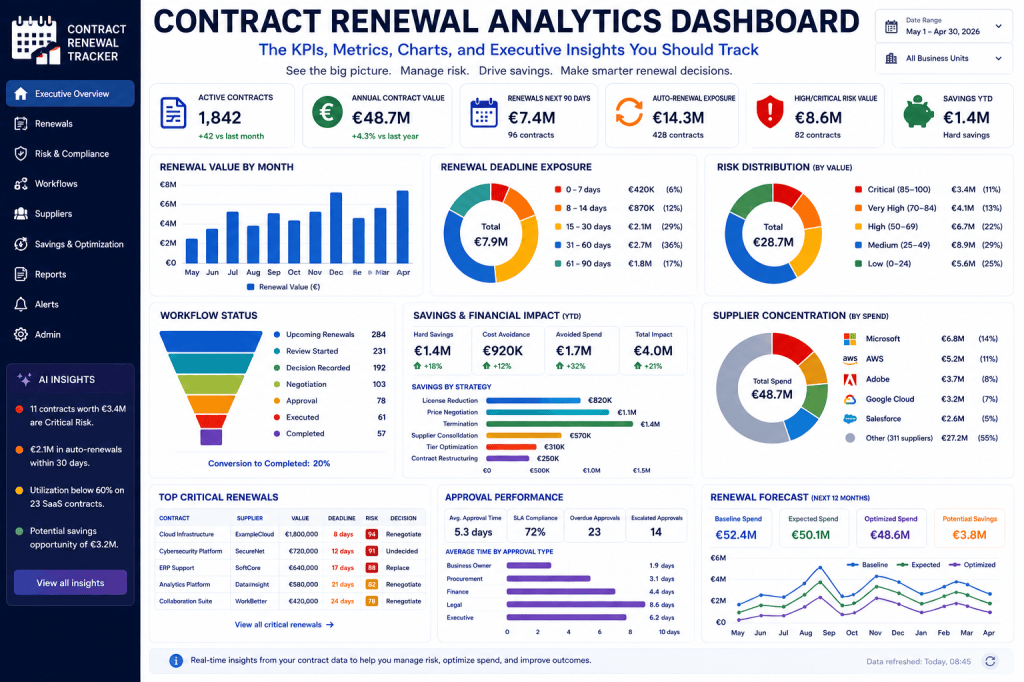
From Contract Tracker to Management Dashboard
The Contract Renewal Tracker already captures valuable information:
- suppliers;
- contract values;
- start and end dates;
- renewal dates;
- notice periods;
- auto-renewal clauses;
- contract owners;
- workflow stages;
- decisions;
- approvals;
- risk scores;
- pricing;
- savings;
- utilization;
- renewal outcomes.
Individually, these fields help manage contracts.
Aggregated, they reveal how the organization manages its entire renewal portfolio.
The architecture becomes:
Contracts
↓
Renewal Events
↓
Workflow Data
↓
Financial Data
↓
Risk Data
↓
Analytics
↓
Management Decisions
This is the foundation of renewal intelligence.
Start with the Executive Summary
The first dashboard should answer the most important questions in seconds.
A useful executive summary might show:
Contract Portfolio
Active Contracts: 1,842
Annual Contract Value: €48.7M
Active Suppliers: 316
Upcoming Renewals
Next 30 Days: €2.8M
Next 90 Days: €7.4M
Next 180 Days: €16.2M
Next 12 Months: €38.9M
Risk
Critical Renewals: 11
Very High Risk: 24
High Risk: 58
Value at High/Critical Risk: €8.6M
Auto-Renewal Exposure
Auto-Renewing Contracts: 428
Annual Value: €14.3M
Notice Deadlines Within 30 Days: €2.1M
Optimization
Savings YTD: €1.4M
Cost Avoidance: €920K
Avoided Spend: €1.7M
Open Optimization Opportunity: €3.2M
An executive can understand the overall renewal position immediately.
KPI 1: Active Contract Count
The simplest portfolio metric is:
Active Contracts
This tells the organization how many agreements are currently being managed.
But it becomes more useful when segmented.
For example:
Software:
420
Professional Services:
318
Facilities:
190
Telecommunications:
84
Marketing:
162
Other:
668
This helps management understand portfolio composition.
KPI 2: Annual Contract Value
Contract count alone can be misleading.
One organization may manage 5,000 low-value subscriptions.
Another may manage 500 contracts worth hundreds of millions.
Therefore, dashboards should also track:
Annual Contract Value
or:
Annualized Contract Spend
For example:
Total active contract value:
€48.7M
This provides financial context.
KPI 3: Upcoming Renewal Value
One of the most important dashboard metrics is:
How much contract value is approaching renewal?
For example:
30 Days
€2.8M
60 Days
€4.9M
90 Days
€7.4M
180 Days
€16.2M
365 Days
€38.9M
This creates a renewal-value pipeline.
Renewal Value by Month
A monthly chart can reveal concentration.
For example:
| Month | Renewal Value |
|---|---|
| January | €2.1M |
| February | €1.7M |
| March | €4.8M |
| April | €2.6M |
| May | €3.1M |
| June | €5.9M |
| July | €2.4M |
| August | €2.8M |
| September | €4.3M |
| October | €3.9M |
| November | €2.7M |
| December | €6.6M |
Immediately, June and December stand out.
Those months may require additional procurement, legal, and approval capacity.
Renewal Count vs Renewal Value
These metrics should be displayed together.
Suppose:
March
52 renewals.
Value:
€1.2M.
June
18 renewals.
Value:
€7.8M.
March has more contracts.
June has much greater financial exposure.
Management needs both perspectives.
KPI 4: Notice Deadline Exposure
Expiration dates are not enough.
The dashboard should show when contractual decision windows are closing.
For example:
Notice Deadline Exposure
Within 7 days:
€420K
Within 14 days:
€870K
Within 30 days:
€2.1M
Within 60 days:
€4.8M
Within 90 days:
€7.9M
This answers a more important question:
How much contract value is about to lose termination flexibility?
Decision Exposure
An even stronger metric combines notice deadlines with decision status.
For example:
Notice deadlines within 30 days:
€2.1M
Of which:
Renew decision:
€620K
Renegotiate:
€540K
Terminate:
€210K
Undecided:
€730K
That €730K deserves attention.
KPI 5: Auto-Renewal Exposure
A dedicated section should monitor automatic renewals.
For example:
Auto-renewing contracts:
428
Annual value:
€14.3M
Renewing within 90 days:
€4.1M
Decision pending:
€1.6M
High/Critical risk:
€2.3M
This tells management where inaction could create financial commitments.
Auto-Renewal Commitment Exposure
Annual value does not always represent the full risk.
Suppose:
Annual value:
€1M.
Renewal term:
36 months.
Potential commitment:
€3M
Therefore, the dashboard can track:
Potential Auto-Renewal Commitment
rather than only annual spend.
For example:
Annual auto-renewal value:
€14.3M
Potential contractual commitment:
€22.8M
This can materially change management’s perception of exposure.
KPI 6: Renewal Risk Distribution
The risk-scoring engine from the previous article can feed directly into the dashboard.
For example:
Critical
11 contracts
€3.4M
Very High
24 contracts
€4.1M
High
58 contracts
€6.7M
Medium
126 contracts
€8.9M
Low
207 contracts
€5.6M
The dashboard should show both:
number of contracts
and:
financial value.
Risk Distribution Chart
A donut or stacked bar chart can visualize portfolio risk.
For example:
Low:
49%
Medium:
29%
High:
14%
Very High:
6%
Critical:
2%
But percentages alone can hide financial concentration.
The 2% of critical contracts may represent 25% of the renewal value.
Therefore, pair risk count with Value at Risk.
KPI 7: Value at Risk
A useful management metric is:
Renewal Value at Risk
For example:
High:
€6.7M
Very High:
€4.1M
Critical:
€3.4M
Combined High-to-Critical exposure:
€14.2M
This helps executives understand the financial significance of operational risk.
Risk Heatmap
A heatmap can plot:
Deadline Urgency
against:
Financial Exposure
For example:
| Low Value | Medium Value | High Value | |
|---|---|---|---|
| 90+ Days | Low | Low | Medium |
| 31–90 Days | Low | Medium | High |
| 0–30 Days | Medium | High | Critical |
Individual contracts can appear as points or bubbles.
Bubble size could represent total renewal commitment.
This makes the most important contracts visually obvious.
KPI 8: Renewal Decisions
The dashboard should show what the organization plans to do.
For example:
Renewal Decisions
Renew:
142
Renegotiate:
91
Terminate:
38
Replace:
16
Consolidate:
12
Temporary Extension:
9
Undecided:
54
The most important number may be:
Undecided
particularly when those contracts are approaching notice deadlines.
Decision Value
Contract counts should again be accompanied by value.
For example:
Renew:
€8.4M
Renegotiate:
€6.7M
Terminate:
€1.8M
Replace:
€1.1M
Undecided:
€4.9M
This tells management how much spend remains unresolved.
KPI 9: Workflow Status
The renewal workflow dashboard can show where contracts currently sit.
For example:
Upcoming:
83
Business Review:
47
Negotiation:
62
Legal Review:
31
Approval:
28
Execution:
19
Completed:
146
Overdue:
23
This provides an operational view of the renewal pipeline.
Workflow Funnel
A funnel visualization can show progression.
For example:
Upcoming Renewal:
284
Review Started:
231
Decision Recorded:
192
Negotiation Required:
103
Approved:
78
Executed:
61
Completed:
57
If large numbers accumulate at a stage, that may indicate a bottleneck.
KPI 10: Overdue Renewal Tasks
The dashboard should track incomplete tasks.
For example:
Total overdue tasks:
87
Contracts affected:
31
Average overdue duration:
6.4 days
Critical contracts with overdue tasks:
8
This helps contract managers intervene before workflow delays become missed deadlines.
Overdue Tasks by Function
For example:
Business Owners:
24
Procurement:
19
Legal:
21
Finance:
13
Security:
7
Executive Approval:
3
This reveals where renewal workflows are slowing down.
KPI 11: Approval Bottlenecks
Approval analytics are particularly useful for large organizations.
For example:
| Approval Type | Average Time |
|---|---|
| Business | 1.9 days |
| Procurement | 3.1 days |
| Finance | 4.4 days |
| Legal | 8.6 days |
| Executive | 6.2 days |
Legal review may be the largest bottleneck.
That insight can influence workflow planning.
Approval SLA Performance
Suppose the organization’s target is:
Legal approval:
5 business days.
Actual average:
8.6 days.
SLA compliance:
58%
The Contract Renewal Tracker can automatically start legal review earlier for future contracts.
Analytics can therefore improve workflow design.
KPI 12: Renewal Cycle Time
Renewal Cycle Time measures:
Workflow Start → Final Outcome
For example:
Overall average:
64 days
Low-value contracts:
18 days
Standard contracts:
47 days
Strategic contracts:
138 days
This helps determine when renewal workflows should begin.
Cycle Time Trend
The dashboard should show whether renewal processes are improving.
For example:
Q1:
78 days.
Q2:
70 days.
Q3:
64 days.
Q4:
57 days.
This indicates increasing operational efficiency.
KPI 13: On-Time Renewal Completion
A critical performance metric is:
Percentage of Renewals Completed Before Internal Deadline
For example:
Total completed renewals:
180
Completed on time:
164
On-time rate:
91.1%
The organization may target:
95%+
This provides a simple measure of renewal process reliability.
KPI 14: Missed Notice Deadlines
This should be one of the most visible governance metrics.
For example:
Missed deadlines YTD:
7
Value affected:
€820K
Potential unwanted commitment:
€1.4M
A mature renewal operation should aim to drive this metric toward zero.
Root Causes of Missed Deadlines
The dashboard can categorize causes.
For example:
No owner:
2
Incorrect notice date:
1
Approval delay:
2
Supplier dispute:
1
Workflow not started:
1
This converts failures into process-improvement data.
KPI 15: Savings Realized
The cost optimization capability should feed directly into executive reporting.
For example:
Renewal Savings YTD
Hard savings:
€1.4M
Cost avoidance:
€920K
Avoided spend:
€1.7M
Supplier consolidation:
€430K
Total documented financial impact:
€4.45M
This demonstrates the financial value of renewal management.
Savings by Category
For example:
Software:
€1.8M
Cloud:
€940K
Professional Services:
€620K
Telecommunications:
€410K
Facilities:
€380K
Other:
€300K
This helps procurement identify where optimization programs are most successful.
Savings by Strategy
Another useful chart shows how savings were achieved.
For example:
License reduction:
€820K
Price negotiation:
€1.1M
Termination:
€1.4M
Supplier consolidation:
€570K
Tier optimization:
€310K
Contract restructuring:
€250K
This provides insight into which strategies generate the most value.
KPI 16: Open Optimization Opportunity
Realized savings are backward-looking.
The dashboard should also show future opportunities.
For example:
Low utilization:
€1.1M
Proposed price increases:
€870K
Duplicate tools:
€640K
Supplier consolidation:
€520K
Benchmark gaps:
€410K
Total identified opportunity:
€3.54M
This becomes the procurement savings pipeline.
Opportunity by Renewal Horizon
The system can prioritize opportunities by timing.
For example:
Next 30 Days
€420K opportunity.
Next 90 Days
€1.2M.
Next 180 Days
€2.4M.
Next 12 Months
€5.8M.
This tells procurement when resources are needed.
KPI 17: Supplier Concentration
Supplier concentration is important for both financial and operational risk.
For example:
Top supplier:
€6.8M
Second supplier:
€4.9M
Third supplier:
€3.2M
Top five suppliers:
43% of total contract spend
High concentration may create:
- dependency risk;
- negotiation opportunities;
- continuity risk;
- consolidation opportunities.
Supplier Renewal Exposure
The dashboard can combine supplier concentration with renewal timing.
For example:
ExampleCloud
Annual spend:
€4.2M
Contracts:
7
Renewing within 180 days:
5
Value renewing:
€3.4M
This is strategically important.
Procurement may want a supplier-level negotiation rather than five independent renewals.
KPI 18: Contract Owner Performance
This metric needs careful interpretation.
The objective should not be simplistic employee ranking.
Useful operational indicators include:
- renewal workflows started on time;
- overdue tasks;
- decision completion;
- missing data;
- escalation frequency.
For example:
Business Unit A:
96% on-time reviews.
Business Unit B:
74%.
The organization can investigate whether Business Unit B needs better processes or additional support.
KPI 19: Contract Data Quality
Analytics are only reliable if the underlying data is reliable.
The dashboard should therefore track:
Contracts Missing End Date
Contracts Missing Owner
Unknown Auto-Renewal Status
Unverified Notice Period
Missing Contract Value
Conflicting Renewal Terms
For example:
Total active contracts:
1,842
Complete renewal metadata:
1,691
Data completeness:
91.8%
Improving this percentage should be an operational goal.
Data Confidence Dashboard
The system might classify:
Verified:
78%
AI-extracted + verified:
14%
AI-extracted, awaiting verification:
6%
Incomplete:
2%
This tells users how much trust they can place in portfolio analytics.
KPI 20: Renewal Forecast
The Contract Renewal Tracker can forecast future contract spend.
For example:
Current annual spend:
€48.7M
Known contractual increases:
+€2.3M
Expected new spend:
+€1.1M
Planned terminations:
−€1.8M
Expected negotiated savings:
−€1.4M
Forecast next-year spend:
€48.9M
This connects contract renewal directly to financial planning.
Baseline vs Optimized Forecast
The dashboard can compare scenarios.
Baseline
Renew everything under proposed terms.
Projected spend:
€52.4M
Expected
Apply current negotiation assumptions.
Projected spend:
€50.1M
Optimized
Apply identified savings opportunities.
Projected spend:
€48.6M
Potential difference:
€3.8M
This is highly useful for finance and procurement leadership.
Executive Renewal Calendar
Executives usually do not need every contract.
They need significant upcoming decisions.
For example:
Next 30 Days
Cloud Infrastructure
€3.2M commitment
Decision: Renegotiate
Risk: Critical
Cybersecurity Platform
€780K commitment
Decision: Renew
Risk: High
Next 60 Days
ERP Support
€1.1M commitment
Decision: Replace
Risk: High
This creates an executive decision calendar.
Department Dashboards
Different functions need different views.
Procurement Dashboard
Focus on:
- negotiation pipeline;
- savings opportunities;
- supplier concentration;
- price increases;
- benchmarks.
Legal Dashboard
Focus on:
- notice deadlines;
- legal reviews;
- contract deviations;
- termination notices;
- unresolved clauses.
Finance Dashboard
Focus on:
- upcoming commitments;
- budget impact;
- price increases;
- savings;
- forecasted spend.
Business Owner Dashboard
Focus on:
- contracts owned;
- upcoming decisions;
- overdue tasks;
- utilization;
- approvals.
Executive Dashboard
Focus on:
- material exposure;
- critical risk;
- large commitments;
- savings;
- strategic decisions.
The same data platform supports different perspectives.
Drill-Down Analytics
Every dashboard metric should allow users to investigate the underlying contracts.
For example:
Critical Renewals: 11
Click.
The user sees:
| Contract | Supplier | Value | Deadline | Risk |
|---|---|---|---|---|
| Cloud Infrastructure | Supplier A | €1.8M | 8 days | 94 |
| Cybersecurity | Supplier B | €720K | 12 days | 91 |
| ERP Support | Supplier C | €640K | 17 days | 88 |
Click again.
Open the individual renewal workspace.
Analytics should lead directly to action.
Filters
Dashboards should support filters such as:
- business unit;
- supplier;
- contract category;
- owner;
- country;
- value range;
- renewal period;
- risk level;
- workflow status;
- renewal decision;
- auto-renewal status.
For example:
Show all IT contracts above €250,000 with notice deadlines in the next 90 days and risk score above 70.
This creates targeted management views.
Saved Views
Users should be able to save common filters.
Examples:
My Renewals
Executive Renewals
Critical Auto-Renewals
Software Renewals Next Quarter
Contracts Above €500K
Pending Legal Review
High Savings Opportunities
This reduces repeated manual analysis.
Trend Analysis
A mature dashboard should show changes over time.
For example:
Critical Renewals
January:
24
February:
19
March:
14
April:
9
The downward trend suggests improved renewal control.
Or:
Average Supplier Increase
2026:
4.8%
2027:
6.1%
2028:
8.3%
That trend may require a stronger negotiation strategy.
Portfolio Comparisons
Organizations with multiple business units can compare performance.
For example:
| Business Unit | On-Time Renewal | Savings | Critical Risk |
|---|---|---|---|
| IT | 94% | €1.2M | 6 |
| Marketing | 89% | €320K | 4 |
| HR | 97% | €180K | 1 |
| Operations | 92% | €640K | 3 |
The objective should be identifying process improvements rather than creating simplistic league tables.
AI-Generated Portfolio Insights
AI can help interpret dashboard data.
Instead of requiring managers to inspect every chart, the system could generate:
Weekly Renewal Intelligence
1. Critical Risk
Seven contracts worth €3.8M have notice deadlines within 14 days.
Three remain undecided.
2. Cost Opportunity
Twenty-one SaaS renewals show utilization below 70%.
Estimated optimization opportunity:
€620K annually.
3. Supplier Concentration
Five contracts with the same cloud supplier renew within 120 days.
Combined value:
€4.1M.
Consider consolidated negotiation.
4. Approval Bottleneck
Average legal approval time increased from 6.2 to 9.1 days during the last quarter.
Four high-risk renewals are currently awaiting legal review.
5. Forecast
Current renewal decisions indicate next-year contract spend approximately €1.6M below baseline forecast.
This is significantly more useful than charts without interpretation.
AI-Generated Executive Brief
The system could create a concise executive summary:
The renewal portfolio remains stable overall, but €4.6M of contract value requires decisions within the next 30 days. Three high-value auto-renewing contracts remain undecided, representing €2.1M of potential commitment. Procurement has identified €780K of optimization opportunities across upcoming software renewals, primarily from unused licenses and proposed price increases. Legal review remains the primary workflow bottleneck.
This allows executives to understand the situation quickly.
Natural-Language Analytics
A future Contract Renewal Tracker could allow users to ask questions directly.
For example:
Which contracts above €500,000 renew during the next six months?
How much auto-renewal exposure do we have this quarter?
Which suppliers increased prices more than 10%?
Show me contracts with low utilization and high renewal value.
Why did critical renewal risk increase this month?
How much money have we saved through terminations this year?
The system translates these questions into portfolio analysis.
Proactive Insights
The most valuable analytics may be insights the user did not explicitly request.
For example:
Renewal concentration alert: €8.2M of contract value reaches decision deadlines during September.
or:
Supplier concentration alert: 31% of infrastructure spend is associated with one supplier.
or:
Cost opportunity: 17 SaaS contracts with combined annual value of €1.4M have utilization below 60%.
The system becomes proactive rather than merely reporting historical information.
Dashboard Alerts
Dashboards should surface exceptions prominently.
Examples:
Critical
€2.4M auto-renewal deadline in 7 days.
Warning
11 contracts have no assigned owner.
Opportunity
€480K potential savings from unused licenses.
Workflow
Legal approval backlog increased 34%.
Data Quality
27 contracts have unverified notice periods.
These alerts direct attention immediately.
Avoid Dashboard Overload
A common analytics mistake is displaying too much information.
An executive dashboard with 50 charts can become less useful than one with ten carefully selected metrics.
A strong hierarchy might be:
Level 1 — Executive Overview
Risk, value, deadlines, savings.
Level 2 — Functional Dashboards
Procurement, legal, finance, business.
Level 3 — Portfolio Analysis
Supplier, category, department, geography.
Level 4 — Contract Detail
Individual renewal workspace.
Users progressively drill into detail.
Recommended Executive Dashboard Layout
A practical layout might contain:
Row 1 — Core KPIs
Active Contracts
Annual Value
90-Day Renewal Value
Auto-Renewal Exposure
Critical Risk Value
Savings YTD
Row 2 — Renewal Timeline
12-month renewal value chart.
Row 3 — Risk
Risk distribution.
Value at risk.
Critical renewals.
Row 4 — Workflow
Renewal stages.
Overdue tasks.
Approval bottlenecks.
Row 5 — Financial Optimization
Savings.
Cost avoidance.
Optimization pipeline.
Row 6 — Suppliers
Top suppliers.
Supplier concentration.
Upcoming strategic renewals.
Row 7 — AI Insights
Top risks.
Top opportunities.
Recommended actions.
This provides a balanced management view.
Analytics Architecture
Behind the dashboard, the system needs reliable data.
A simplified architecture could be:
Contract Database
Renewal Workflow Events
Approval Events
Supplier Data
Usage Data
Financial Data
↓
Analytics Layer
↓
Metric Calculations
↓
Risk and Opportunity Models
↓
Dashboard API
↓
Dashboard UI
↓
AI Insight Layer
This architecture separates transactional contract management from analytical processing.
Event History Enables Better Analytics
Instead of storing only the current status, the system should preserve events.
For example:
Renewal created.
Owner assigned.
Review started.
Decision changed.
Supplier proposal received.
Negotiation completed.
Legal approved.
Finance approved.
Contract signed.
This event history enables calculations such as:
- cycle time;
- approval duration;
- stage duration;
- escalation frequency;
- workflow bottlenecks.
Without history, many useful analytics become impossible.
KPI Definitions Need Governance
Different departments may interpret metrics differently.
For example:
What exactly counts as:
Savings?
Is it:
- reduction from previous price?
- reduction from supplier proposal?
- budget reduction?
- avoided future spend?
The organization should define metrics centrally.
For example:
Hard Savings
Reduction against prior comparable spend.
Cost Avoidance
Reduction against supplier’s proposed future cost.
Avoided Spend
Future spend eliminated through termination.
Clear definitions prevent misleading dashboards.
Dashboard Data Freshness
Users should know how current the information is.
For example:
Contract data:
Real time.
Workflow data:
Real time.
Usage data:
Updated daily.
Financial data:
Updated nightly.
Supplier benchmark data:
Updated monthly.
The dashboard can display:
Last Updated: 08:42
or specific source freshness indicators.
Data Quality Should Be Visible
Analytics should not create false confidence.
If 30% of contracts lack verified notice periods, the dashboard should say so.
For example:
Notice Deadline Coverage: 72%
Contract Value Coverage: 96%
Owner Assignment: 98%
Auto-Renewal Verification: 84%
This gives users context for interpreting the numbers.
Measuring Renewal Management Maturity
The dashboard can eventually produce a broader maturity score.
Possible dimensions include:
- contract data completeness;
- deadline control;
- ownership;
- workflow completion;
- approval efficiency;
- missed deadline rate;
- savings capture;
- risk management.
For example:
Renewal Management Maturity
82/100 — Advanced
Strengths:
- strong ownership;
- low missed-deadline rate;
- high savings capture.
Improvement areas:
- legal review cycle time;
- notice-clause verification.
This can guide continuous improvement.
The Renewal Command Center
When all of these capabilities are combined, the dashboard becomes something larger than reporting.
It becomes a Renewal Command Center.
It tells the organization:
What is coming?
What is at risk?
What requires a decision?
Where are workflows stalled?
How much money is exposed?
Where can we save?
Which suppliers matter most?
What should we do next?
That is the difference between storing contract data and using contract intelligence.
Final Thoughts
A Contract Renewal Tracker should ultimately provide three levels of visibility.
Operational Visibility
What does each renewal need next?
Management Visibility
Where are the risks, delays, and opportunities across the portfolio?
Executive Visibility
What financial commitments, strategic risks, and savings opportunities require leadership attention?
The analytics dashboard brings these levels together.
The evolution becomes:
Contract Records → Renewal Events → Structured Workflows → Risk Scores → Cost Optimization → Portfolio Analytics → Executive Intelligence
At this stage, the organization is no longer simply tracking contract expiration dates.
It can understand the financial and operational behavior of its entire contract portfolio.
And the most valuable dashboard is not necessarily the one with the most charts.
It is the one that makes the next important decision obvious.
Next Article in the Contract Renewal Tracker Series
Article 14 — “AI Contract Renewal Assistant: How AI Can Read Contracts, Explain Renewal Risk, and Recommend the Next Best Action”
The next article will introduce the conversational intelligence layer of the platform. It will cover contract clause extraction, grounded contract Q&A, renewal summaries, deadline explanations, risk explanations, next-best-action recommendations, supplier negotiation preparation, portfolio questions, confidence and citations, human approval, AI guardrails, and how users could interact with the Contract Renewal Tracker through a natural-language renewal assistant.

